Ask a mill’s finance team where cost lives and they’ll point to labor, fabric, and chemicals first, since those show up as the largest line items on a bill of materials. Ask the same question of anyone who’s actually chased down why a month’s operating cost came in over budget, and utilities come up far more often than the org chart would suggest. Steam, compressed air, electrical power, and water don’t appear on a garment’s cost sheet the way fabric does, but they underwrite every single process covered elsewhere, and a mill that doesn’t manage them deliberately is quietly leaking margin in a place few people are watching closely.
The Cost of Getting Utility Planning Wrong
A few real-world patterns illustrate what happens when utility planning gets treated as an afterthought to machinery and chemical decisions rather than planned alongside them. A mill that adds three new dyeing machines to expand capacity without a corresponding boiler capacity review often finds the new machines simply can’t run at their rated output during peak periods, since steam supply becomes the actual constraint even though the machines themselves are perfectly capable. A mill that adds compressed air-dependent finishing equipment without checking existing compressor capacity finds pressure dropping across the whole system during that equipment’s operating cycles, degrading performance on machines that have nothing to do with the new addition. And a mill that builds out water-intensive processing capacity without a corresponding review of effluent treatment capacity can find itself out of compliance with discharge permits the moment the new capacity comes fully online, a considerably more expensive problem to discover after installation than to have planned around from the start.
None of these are hypothetical edge cases. They’re the predictable result of treating utility capacity as something that will “probably be fine” rather than calculating it alongside every machinery and chemical decision the rest of this guide covers. The cost of that planning gap is rarely visible in a single line item, it shows up as chronic underperformance, unplanned capital spending to fix a capacity shortfall after the fact, or compliance exposure that could have been avoided with a modest amount of upfront calculation.
Setting an Annual Utility Review Cadence
Pulling together the ownership, benchmarking, and capital planning threads covered throughout this guide, a practical way to keep utility performance from drifting is a defined annual review cycle, distinct from the day-to-day operational monitoring each system requires. This annual review pulls together the year’s system-level cost breakdown, compares actual consumption against the mill’s own historical baseline and relevant external benchmarks, reviews progress against any efficiency investments made during the year, and sets priorities for the coming year’s capital planning cycle referenced above. Mills that run this kind of structured annual review consistently tend to show steadier year-over-year improvement in utility cost per unit of output than mills relying purely on ad hoc attention whenever a specific problem becomes visible, simply because the annual cadence forces a regular, disciplined look at the full picture rather than only the specific system that happens to be causing visible trouble in a given month.
How the Four Systems Interact With Each Other
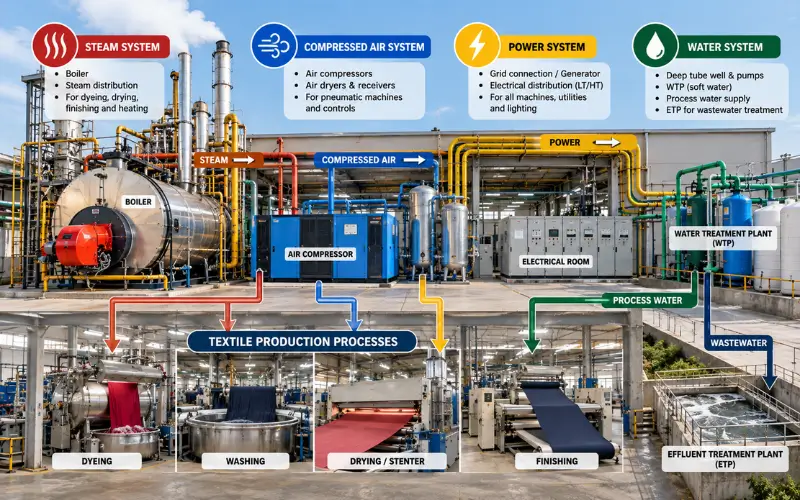
Steam, compressed air, power, and water don’t operate as four fully independent systems inside a mill, and treating them that way in planning misses real interactions worth understanding. A boiler consumes electrical power for its own pumps, fans, and control systems, meaning steam generation itself shows up partly as an electrical load, not purely as a fuel cost. Compressed air compressors generate substantial waste heat during compression, and some mills capture a portion of that waste heat for space heating or preheating applications, an interaction between the compressed air and thermal energy systems that’s easy to overlook if each utility is planned in isolation. Water treatment for boiler feedwater draws on the water system’s quality and treatment capacity, connecting water management directly to steam system performance and efficiency, as covered in the boiler article. And effluent volume, driven by process water consumption established through machinery and chemical choices covered elsewhere, directly sizes the water treatment burden our ETP and ZLD article addresses.
Recognizing these interactions matters practically for capital planning: an efficiency investment in one system sometimes creates a secondary effect on another, and a mill that evaluates each utility system purely in isolation risks either missing a compounding benefit (like waste heat recovery from compressed air) or underestimating a compounding cost (like increased water treatment burden from a machinery expansion that wasn’t planned alongside a corresponding effluent capacity review).
Why Utilities Deserve Their Own Chapter
Machinery selection, covered across our Garment Machinery and Processing Machinery guides, and chemical selection, covered in our Textile Chemicals guide, both draw directly on utility capacity to actually function. A dyeing machine’s rated capacity means nothing if the boiler can’t supply steam fast enough to hit process temperature on schedule. A factory’s sewing floor stalls if compressed air pressure drops during peak demand. Utility systems are the connective infrastructure the rest of a mill’s operation depends on, and treating them as a background cost rather than a managed system is one of the more consistent blind spots in mill operations.
Steam Systems
Steam remains the primary heat source for textile wet processing, dyeing, drying, and various finishing steps all draw on it. A boiler generates that steam, sized against total process steam demand, and the sizing decision itself, covered in a dedicated article, needs to account for peak demand across the mill’s actual process schedule rather than average demand, since undersizing creates a real production bottleneck during peak periods.
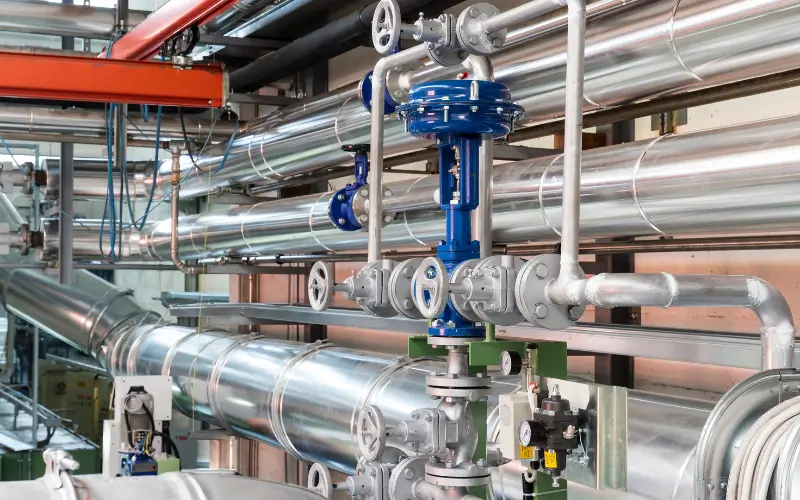
Steam distribution loses energy in ways that are individually small but collectively costly. Steam traps, small devices that release condensate while retaining steam within the distribution system, fail over time, and a failed-open trap leaks live steam continuously, a genuinely expensive and easily overlooked loss covered in its own dedicated article. Insulation on steam lines and equipment reduces radiant heat loss along the distribution path, and poorly insulated or damaged insulation sections lose real energy that never reaches the process it was intended for. Condensate recovery, capturing and returning condensate to the boiler feed system rather than discarding it, recovers both water and the substantial heat energy still present in condensate, reducing the fuel needed to raise fresh feedwater to steam temperature.
Fuel choice for boiler operation, most commonly natural gas in current Bangladeshi mill practice given the country’s gas infrastructure, though fuel oil and other options remain in use depending on regional gas availability and pricing, affects both running cost and the efficiency losses a mill needs to plan for, covered in more depth in the boiler selection article.
Compressed Air Systems
Compressed air powers pneumatic equipment across a mill, cutting tables, certain sewing floor equipment, pressing machinery, and specific processing machinery functions all draw on it, and it’s often called the most expensive utility per unit of useful energy delivered, since compressing air is inherently inefficient compared to delivering the same mechanical work through electricity directly.
CFM demand (cubic feet per minute, the standard measure of compressed air flow) needs to be calculated against actual connected equipment and realistic simultaneous usage, not simply summed from every piece of equipment’s rated maximum draw, since equipment rarely all draws peak air simultaneously in real operation. Compressed air leaks are the compressed air system’s equivalent of failed steam traps, individually small but collectively expensive, and a mill that hasn’t run a dedicated leak audit in some time is very likely paying for a meaningful volume of compressed air that’s escaping into the factory environment rather than doing useful work. VSD (variable speed drive) compressors, which adjust motor speed to match actual demand rather than running at fixed speed regardless of load, offer a real efficiency improvement over fixed-speed compressors in facilities with variable demand patterns, and the ROI calculation for upgrading to VSD technology gets its own dedicated treatment.
Pressure drop across the distribution system, from compressor to point of use, represents further loss, and a system with excessive pressure drop forces the compressor to run at higher output pressure than actually needed at the point of use, just to compensate for losses along the way, an inefficiency that’s often invisible until someone actually measures pressure at multiple points through the system rather than just at the compressor output.
Electrical Power
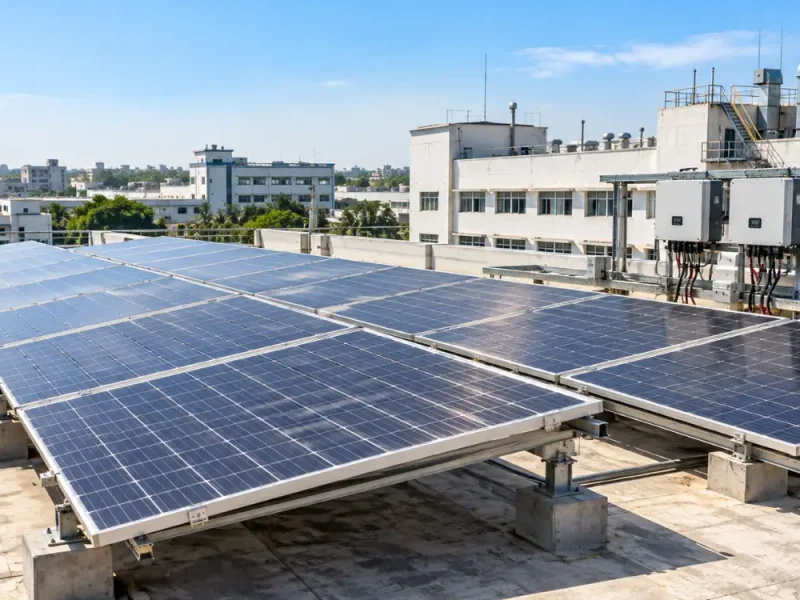
Power draws across a mill’s full range of equipment, sewing machines, processing machinery motors, lighting, air conditioning where used, and increasingly, on-site generation where mills have added rooftop solar capacity, covered in its own dedicated article given the specific policy and payback considerations involved in Bangladesh currently.
Power quality and reliability matter as much as raw consumption for a mill’s operating cost, since voltage fluctuation or supply interruption can damage sensitive equipment or interrupt processes mid-cycle in ways that cost far more than the electricity itself, particularly for processes like dyeing where an interrupted cycle can mean a spoiled batch, not just a delayed one.
Water Systems
Water enters a mill’s utility picture on both the supply and treatment sides. Supply-side water quality, hardness and mineral content particularly, affects wet processing directly, since hard water interferes with dyeing and can require additional sequestering chemical treatment, covered in our Textile Chemicals guide, simply to compensate for a water quality issue that better water treatment could address more fundamentally.
Treatment-side, every liter of process water eventually needs to be managed as effluent, and the choice between conventional effluent treatment and more advanced approaches like zero liquid discharge, covered in a dedicated article, carries real capital and operating cost implications that connect directly to a mill’s water consumption patterns established through machinery and chemical choices covered elsewhere.
What Each System Actually Costs to Run
Building an honest picture of utility running cost means going beyond the monthly utility bill total and breaking cost down by system, steam (fuel cost plus water and chemical treatment for boiler feedwater), compressed air (electricity cost for compression, which scales with both demand and system efficiency), power (direct electricity cost plus any on-site generation offset), and water (supply cost plus treatment cost for both incoming water quality adjustment and outgoing effluent treatment). A mill that only tracks a single blended utility cost figure per month has much less ability to identify which system is actually driving cost changes month to month, or which efficiency investment would deliver the best return.
Building Utility Costs Into Capital Planning Cycles
Utility efficiency investments, the steam trap survey, the compressed air upgrade, the boiler right-sizing, all compete for the same capital budget as machinery purchases and facility expansion, and mills that treat utility investment as a separate, lower-priority category from production capital tend to underfund it chronically relative to what the actual payback calculations would justify. A more effective approach folds utility efficiency proposals into the same capital planning cycle and the same return-on-investment evaluation standard applied to machinery purchases, since, as the individual articles demonstrate, many utility efficiency investments show payback periods considerably shorter than typical machinery capital, sometimes under a year for measures like steam trap repair.
Building this into a standing annual or semi-annual capital planning review, rather than only considering utility investment reactively when a problem becomes visible, is what separates mills that steadily improve their utility cost position over time from mills that address utility issues only in crisis mode, after a compliance failure, a major breakdown, or a utility cost spike that finally forces the conversation. The related articles below are built to support exactly this kind of proactive planning cycle, giving a mill’s operations and finance teams a shared, calculable basis for prioritizing utility investment alongside every other capital demand on the business.
Where Savings Usually Sit
Across the systems covered in this guide, a consistent pattern shows up: the biggest, most visible capital equipment (the boiler, the main compressor) usually isn’t where the largest recoverable savings sit. It’s in the distribution and maintenance layer, failed steam traps, compressed air leaks, damaged insulation, that quietly consumes budget without anyone noticing until someone actually runs the kind of dedicated audit covered in several related articles. This isn’t to say equipment selection doesn’t matter, a well-sized, efficient boiler and a VSD compressor genuinely outperform poorly matched or outdated equivalents, but the maintenance and distribution-layer losses are often the more immediately actionable savings opportunity, since they don’t require new capital investment, just the discipline to find and fix what’s already failing quietly.
A Worked Illustration of Total Utility Cost Breakdown
To make the “break cost down by system” guidance above concrete, consider a mid-sized dyeing and finishing mill with an illustrative total monthly utility bill of \$180,000. Broken down by system rather than treated as a single blended figure: steam generation (fuel cost) might represent roughly \$95,000 of that total, compressed air electricity roughly \$18,000, general power for motors, lighting, and other equipment roughly \$52,000, and water supply plus effluent treatment roughly \$15,000.
Presented this way, steam generation immediately stands out as the largest single category, more than half of total utility cost, which directs attention toward the boiler efficiency, steam trap, and insulation topics covered elsewhere on the site as the highest-impact area for cost reduction. A mill that only tracks the \$180,000 blended total has no way to see this breakdown, and might instead focus improvement efforts on whichever system happens to be most visible or most recently discussed, rather than the one actually driving the largest share of cost. This is the practical argument for system-level utility cost tracking made concrete: it’s not just good bookkeeping, it directly shapes where a mill should spend its limited efficiency investment budget for the best return.
Benchmarking Utility Performance
Comparing a mill’s actual utility consumption against reasonable external benchmarks, covered in the dedicated energy benchmarking article, gives a mill a way to judge whether its utility performance sits within a normal range or represents a real opportunity for improvement. As with the chemical consumption benchmarking in our Textile Chemicals guide, these figures vary enormously based on process mix, machine age, and fabric type, so they’re most useful as a directional check rather than a universal target every mill should hit regardless of its specific operating context.
Who Actually Owns Utility Performance
A recurring gap in mills that underperform on utility efficiency, even relative to their own machine technology’s realistic potential, isn’t a lack of technical knowledge so much as unclear ownership. Steam system performance often sits with a boiler operator focused purely on keeping the boiler running, without a clear mandate or metric tied to distribution-side losses like the trap and insulation issues covered. Compressed air often has no dedicated owner at all, treated as a background utility rather than a system with its own efficiency metrics anyone is accountable for. Electrical power usually falls to a general facilities or maintenance function without energy-specific KPIs.
Mills that perform well on utility efficiency tend to share a common structural feature: a specific person or small team with utility performance as an actual, measured part of their role, tracking the system-level cost breakdown covered above over time, running the periodic surveys and audits covered in related guides on a defined schedule, and reporting findings in terms decision-makers can act on, concrete fuel cost figures rather than general statements that “the system seems fine.” This organizational point is easy to overlook in a purely technical discussion of boilers and compressors, but it’s often the actual determining factor in whether a mill’s utility systems perform close to their technical potential or quietly underperform it year after year without anyone specifically responsible for closing that gap.
A Final Word on Utility Systems as Infrastructure, Not Overhead
The framing that ties this entire guide together is worth stating explicitly: utility systems are production infrastructure, not background overhead sitting outside the “real” work of making garments. A dyeing machine’s output is only as good as the steam supply behind it. A cutting table’s uptime depends on compressed air being available at the pressure it needs. Every part of this guide, garment machinery, textile chemicals, and processing machinery, ultimately depends on the utility systems covered here functioning reliably and efficiently. Mills that internalize this framing, treating utility performance with the same planning rigor applied to machinery and chemistry, consistently outperform mills that treat utilities as a fixed cost to be paid rather than a system to be actively managed.
Passing This Knowledge Forward
A mill’s utility performance rarely stays with a single individual for the full life of the facility, staff move on, roles change, and knowledge built through years of running steam trap surveys or fine-tuning compressor sequencing can walk out the door with whoever built it unless it’s genuinely documented and institutionalized. Building the survey findings, calculation methods, and benchmark comparisons covered in related guides into a standing internal reference, rather than leaving them as informal knowledge held by whoever currently manages utilities, protects the mill’s investment in building this capability in the first place, and gives the next person in that role a genuine starting point rather than having to rediscover the same lessons from scratch.
Certification and Compliance Considerations
Utility performance increasingly factors into formal certification requirements beyond simple cost management. LEED certification, covered in a dedicated article, evaluates energy and water efficiency as core credit categories, and pursuing LEED certification for a textile or garment facility means utility system performance becomes a documented, audited part of the certification process rather than purely an internal cost management concern.
How This Guide Is Organized
The related articles below go deeper into specific utility topics: boiler capacity calculation, steam trap surveys and their cost impact, compressed air system ROI modeling, effluent treatment approach comparison, energy consumption benchmarking, rooftop solar payback in the current Bangladeshi policy environment, heat recovery from dyeing effluent, and the utility-specific requirements behind LEED certification. Each connects back to the framework laid out here, and each is written to stand on its own for whichever specific utility decision is currently in front of you.
Frequently Asked Questions
Why do utility systems matter as much as machinery selection?
Every machine in a mill depends on utility systems to actually function. A dyeing machine’s rated capacity means nothing if steam supply can’t keep pace, which is why utility planning needs to happen alongside, not after, machinery decisions.
What’s usually the biggest recoverable savings opportunity in mill utilities?
Often not the largest capital equipment but the distribution and maintenance layer, failed steam traps, compressed air leaks, damaged insulation, since these losses are individually small but collectively expensive and easy to miss without deliberate auditing.
Which utility system typically costs the most to run in a textile mill?
Steam generation usually represents the largest single share of total utility cost, given how thermally intensive dyeing, drying, and finishing processes are, which is why boiler efficiency and distribution losses deserve priority attention.
Does pursuing LEED certification require different utility investments than just cutting costs?
Largely no. LEED’s energy and water credits reward much of the same efficiency work that reduces operating cost directly, formalized into a documented, measured framework rather than requiring separate investment.