
A mill manager who can quote machine capacity and labor cost per shift from memory often can’t say, without pulling reports, what a kilogram of fabric actually costs in chemicals to process. That gap matters, because chemical cost is one of the more controllable line items in a mill’s cost structure, and controlling it starts with knowing where actual consumption stands against a reasonable benchmark.
Why Benchmarking by Kilogram Matters
Chemical, water, and dye consumption scale with fabric weight processed, which makes per-kilogram figures the natural unit for comparing performance across batches, machines, or time periods, regardless of order size. A mill running a strong month by total output can still be quietly overconsuming chemicals per kilogram, and total consumption figures alone won’t reveal that the way per-kilogram benchmarking does.
What Drives Consumption Variation
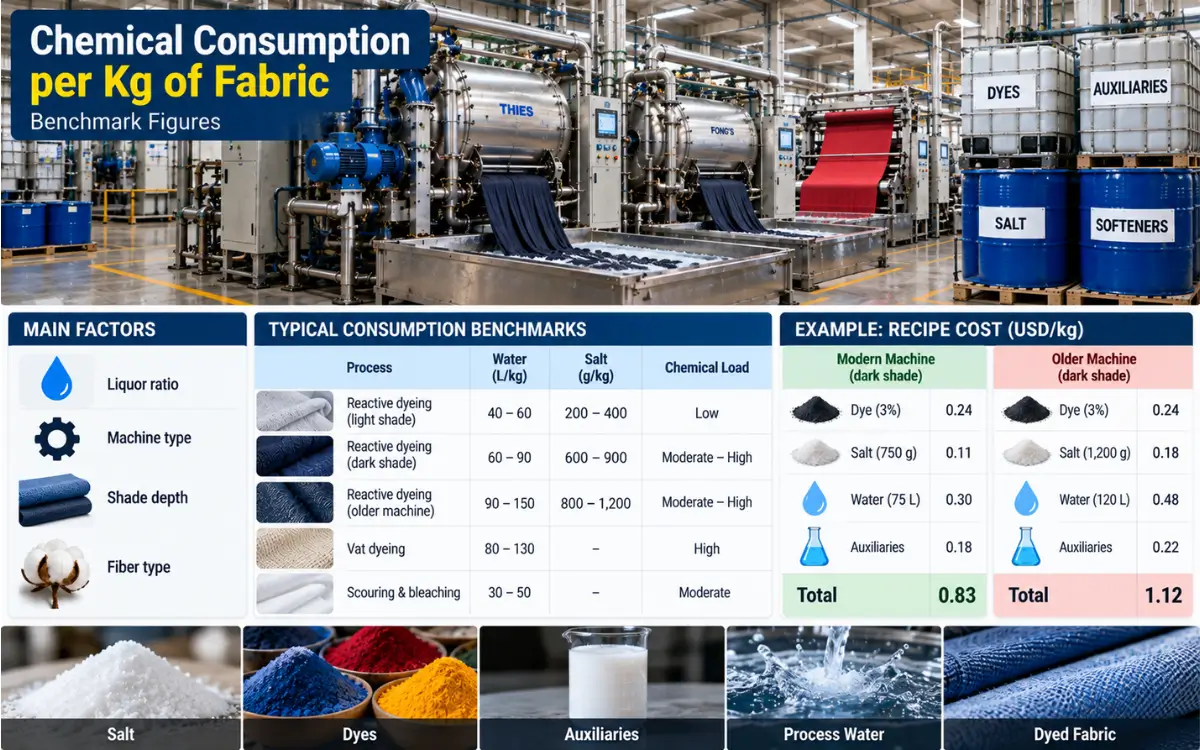
Before looking at benchmark ranges, it’s worth understanding why consumption varies as much as it does between mills and even between batches at the same mill. Liquor ratio, covered in depth Processing Machinery guide, is one of the largest drivers, since a higher liquor ratio directly means more water, and proportionally more salt and chemical, needed to achieve the same effective concentration in the dyebath. Machine type matters for the same reason, with modern low liquor ratio machines consuming meaningfully less water and chemical per kilogram than older, higher liquor ratio equipment processing the same fabric. Shade depth affects dye and salt consumption specifically, with darker, more saturated shades requiring more dye and generally more salt to achieve adequate exhaustion. Fiber type and fabric construction affect nearly every consumption figure, since different fibers absorb water and chemical differently and require different process recipes entirely.
Benchmark Ranges Worth Knowing
Published benchmark figures from sources like IFC PaCT (Partnership for Cleaner Textile) give mills a reasonable external reference point for water and chemical consumption per kilogram of fabric processed, broken down by process type and, in some reporting, by machine technology. These figures are useful as a directional benchmark, showing whether a mill’s actual consumption sits within a reasonable range or well above it, rather than as an exact target every mill should hit regardless of its specific fiber mix, shade portfolio, and machine fleet.
Water consumption benchmarks vary considerably by process, with modern, well-optimized reactive dyeing on efficient machinery achieving meaningfully lower specific water consumption than older equipment or less efficient process design. The gap between a mill running best-practice liquor ratios and modern machinery versus one running older, higher liquor ratio equipment can be substantial on a per-kilogram basis, which is exactly why benchmarking against external reference figures, rather than only against a mill’s own historical performance, is worth doing periodically.
Illustrative Consumption Benchmarks by Process
The table below gives illustrative ranges pulled together from general industry reporting patterns, useful as a rough sanity check against your own mill’s figures. Treat these as directional, not authoritative, for the same reasons covered above: actual consumption depends heavily on liquor ratio, shade depth, and machine technology.
| Process | Water (L/kg) | Salt (g/kg, reactive only) | Typical Chemical Auxiliary Load |
|---|---|---|---|
| Reactive dyeing, light shade, modern low-liquor machine | 40-60 | 200-400 | Low |
| Reactive dyeing, dark shade, modern low-liquor machine | 60-90 | 600-900 | Moderate to high |
| Reactive dyeing, older high-liquor-ratio machine | 90-150 | 800-1,200 | Moderate to high |
| Vat dyeing (any shade) | 80-130 | Not applicable | High (reduction/oxidation chemicals) |
| Scouring and bleaching (pretreatment stage) | 30-50 | Not applicable | Moderate |
A Worked Recipe Cost Example
Here’s how these figures translate into an actual per-kilogram recipe cost, using illustrative unit prices you should replace with your mill’s real current costs. Take a dark-shade reactive dyeing batch on a modern low-liquor machine: 75 liters of water per kilogram, 750 grams of salt per kilogram, and a dye dosage of 3 percent on weight of fabric (30 grams of dye per kilogram) at an illustrative dye cost of $8.00 per kilogram of dye.
Dye cost: 0.030 kg dye × $8.00 = $0.24 per kilogram of fabric.
Salt cost: 0.75 kg salt × $0.15 per kg = $0.11 per kilogram of fabric.
Water cost (including heating energy): 75 liters × $0.004 per liter (combined water charge and heating energy) = $0.30 per kilogram of fabric.
Auxiliary chemicals (sequestering agent, leveling agent, fixing agent combined): estimated at $0.18 per kilogram of fabric based on typical dosing percentages.
Total recipe cost: $0.24 + $0.11 + $0.30 + $0.18 = $0.83 per kilogram of fabric processed.
Now compare that same recipe run on an older, higher liquor ratio machine at 120 liters of water and proportionally higher salt (1,200 grams per kilogram, scaling with the higher liquor weight): water cost rises to 120 × $0.004 = $0.48, and salt cost rises to 1.2 × $0.15 = $0.18, while dye and auxiliary cost stay roughly similar as a percentage of fabric weight. Total recipe cost on the older machine: $0.24 + $0.18 + $0.48 + $0.18 = $1.08 per kilogram, a full $0.25 per kilogram more than the modern low-liquor machine, purely from the liquor ratio difference. Across even a modest 50,000 kilograms of fabric a month, that gap alone represents $12,500 in monthly cost difference between the two machines, which is exactly our kind of figure that makes the liquor ratio discussion in the Processing Machinery guide a genuine capital planning question, not just a technical detail.
Building a Recipe Cost From Consumption Figures
Once actual consumption figures are known for a given process and fabric type, dye cost, salt cost, water cost (including the cost of heating that water, not just the water charge itself), auxiliary chemical cost, and effluent treatment cost attributable to that batch’s water volume, together build into a real recipe cost per kilogram, which is a meaningfully more accurate cost figure than working from dye cost alone, a common shortcut that understates true processing cost by leaving out everything else the recipe actually consumes.
A useful recipe costing approach lists each consumption category (dye, salt, key auxiliaries, water, energy for heating) with its actual measured or benchmarked quantity per kilogram of fabric, multiplied by current unit cost for that input, summed into a total recipe cost per kilogram that can be compared across recipe variations, machine choices, or supplier chemical substitutions on a genuinely comparable basis.
Using Benchmarks to Evaluate a Proposed Chemical Substitution
This kind of full recipe costing becomes particularly valuable when evaluating a proposed chemical substitution, a new softener, a different sequestering agent, or an alternative dye supplier. A substitute chemical with a lower unit price can still increase total recipe cost if it requires higher dosage to achieve the same result, and comparing unit price alone, without running the full consumption-based recipe cost, is a common way mills end up with a substitution that looked cheaper on paper but wasn’t in actual practice once real dosage requirements were accounted for.
Where to Start If You’re Not Currently Benchmarking
For a mill without an established practice of tracking consumption per kilogram, the practical starting point is picking the highest-volume process, most likely standard reactive dyeing on the mill’s primary machine type, and tracking actual dye, salt, auxiliary, and water consumption against output weight for a representative sample of batches over a few weeks. That gives a real, mill-specific baseline to compare against published external benchmarks and, more usefully over time, against the mill’s own future performance as process changes or machine upgrades are introduced. Consumption benchmarking done consistently over time reveals far more about where cost control opportunities actually sit than a single external comparison ever will on its own.
Frequently Asked Questions
Why does liquor ratio affect chemical cost, not just water cost?
Salt and most auxiliary chemicals are dosed as a percentage of liquor weight, so a higher liquor ratio batch needs proportionally more of these chemicals to reach the same effective dyebath concentration, not just more water.
How much can chemical consumption vary between a modern and an older dyeing machine?
The worked example in this article shows roughly a $0.25 per kilogram difference between a modern low-liquor machine and an older high-liquor-ratio machine on the same recipe, which compounds fast across real production volume.
Is a cheaper chemical always the better choice for recipe cost?
Not necessarily. A lower unit price can still increase total recipe cost if the product requires a higher dosage to achieve the same result, which is why comparing full recipe cost, not just unit price, matters for evaluating a substitution.
What’s the first step to start benchmarking chemical consumption if my mill doesn’t track it yet?
Pick the highest-volume process, most likely standard reactive dyeing, and track actual dye, salt, auxiliary, and water consumption against output weight for a representative sample of batches to establish a real, mill-specific baseline.


