Two sewing lines finish the day. Line A made 800 shirts. Line B made 720. The manager of Line A smiles and says his team did better. Is he right? Maybe not. If Line A used 36 operators and Line B used 30, then Line B got more out of every person. That small puzzle shows the difference between productivity and production, two words that people mix up all the time.
This guide explains the difference between productivity and production in plain words. It also covers efficiency, which is a third idea that is often confused with them. You will get the formulas, worked garment line examples and a simple way to remember each term. For ways to raise the numbers in an apparel factory, see our guide on productivity improvement techniques in apparel manufacturing.
Production in simple words
Production is how much you make. It is the total output in a period of time. It is counted in units such as pieces, metres, kilograms or cartons.
- A line makes 800 shirts in a day. Production is 800 pieces.
- A knitting mill makes 5 tonnes of fabric in a shift. Production is 5 tonnes.
- A factory ships 40,000 pieces a month. Production is 40,000 pieces.
Production says nothing about the cost, the people or the time that went into it. A factory can raise production just by adding more machines and workers. That does not mean it works better.
Productivity in simple words
Productivity is how well you turn inputs into output. It compares what you get with what you put in. The inputs can be labour, machines, materials, energy or money.
Productivity = Output ÷ Input
Because there are many inputs, there are many kinds of productivity.
| Type | Formula | Example unit |
|---|---|---|
| Labour productivity | Output ÷ labour hours | Pieces per man-hour |
| Machine productivity | Output ÷ machine hours | Metres per loom-hour |
| Material productivity | Output ÷ material used | Garments per 100 metres of fabric |
| Energy productivity | Output ÷ energy used | Kg of fabric per kWh |
| Total (multifactor) productivity | Total output value ÷ total input cost | Currency out per currency in |
Productivity is about the ratio. The same output from fewer inputs means higher productivity.
Efficiency in simple words
Efficiency compares the actual result with the standard or planned result. It is usually shown as a percentage.
In an apparel factory, the common formula uses the standard minute value, written as SMV or SAM. This is the time a trained operator needs to do a job at a standard pace.
Efficiency (%) = (Output × SAM) ÷ (Operators × Minutes worked) × 100
The top part is the total “earned minutes”, which is the work done in standard time. The bottom is the total minutes available. If a line earns 6,000 minutes out of 10,000 minutes available, efficiency is 60 percent. For more on this, see our report on SMV and efficiency variance in the apparel industry.
Side by side
| Point | Production | Productivity | Efficiency |
|---|---|---|---|
| What it tells | How much was made | Output per unit of input | Actual compared with standard |
| Unit | Pieces, metres, kg | Pieces per man-hour, kg per kWh | Percent |
| Formula | Total output | Output ÷ input | (Earned minutes ÷ available minutes) × 100 |
| Looks at inputs? | No | Yes | Yes, in terms of time |
| Can rise by adding people? | Yes | Not always | Not always |
| Good for | Delivery planning | Comparing cost and resource use | Judging line performance against a target |
A simple memory trick: production is the size of the pile, productivity is the pile per person, and efficiency is the pile compared with the target.
Worked example 1: two lines, one day
Both lines work 8 hours, which is 480 minutes. The shirt has a SAM of 12.
| Line A | Line B | |
|---|---|---|
| Operators | 36 | 30 |
| Output (production) | 800 pieces | 720 pieces |
Productivity (pieces per man-hour):
- Line A = 800 ÷ (36 × 8) = 800 ÷ 288 = 2.78 pieces per man-hour
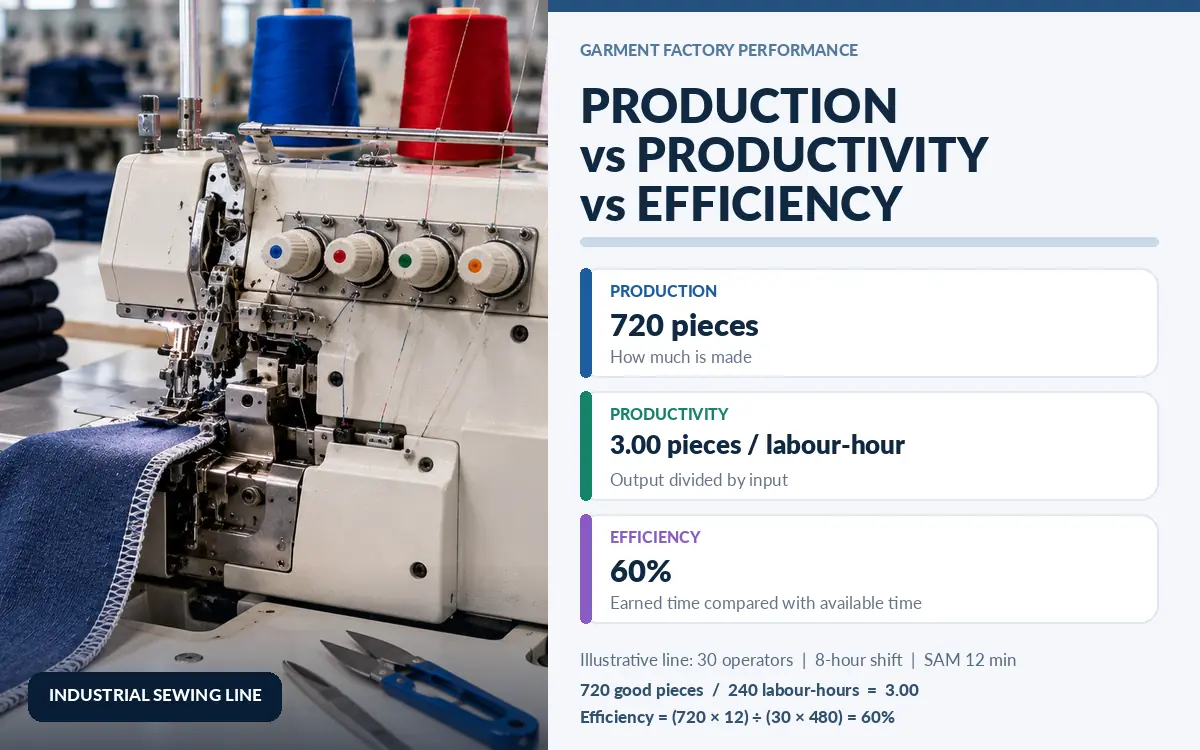
- Line B = 720 ÷ (30 × 8) = 720 ÷ 240 = 3.00 pieces per man-hour
Efficiency:
- Line A = (800 × 12) ÷ (36 × 480) × 100 = 9,600 ÷ 17,280 × 100 = 55.6 percent
- Line B = (720 × 12) ÷ (30 × 480) × 100 = 8,640 ÷ 14,400 × 100 = 60.0 percent
Line A has higher production. Line B has higher productivity and higher efficiency. If the factory pays by the operator, Line B has the lower labour cost per shirt.
Worked example 2: output from a target efficiency
Production can also be planned from the formula. Rearranging the efficiency equation gives:
Output = (Operators × Minutes worked × Efficiency) ÷ SAM
A line has 30 operators and works 8 hours. The shirt has a SAM of 12. The target efficiency is 65 percent.
- Output = (30 × 480 × 0.65) ÷ 12 = 9,360 ÷ 12 = 780 pieces
If the efficiency falls to 55 percent, output is (30 × 480 × 0.55) ÷ 12 = 7,920 ÷ 12 = 660 pieces. A drop of 10 points of efficiency costs 120 pieces a day. Over a 25-day month, that is 3,000 pieces.
Worked example 3: overtime raises production, not always productivity
Say the same line works two hours of overtime, so 10 hours or 600 minutes, and the efficiency falls from 65 to 58 percent, because workers get tired.
- Output = (30 × 600 × 0.58) ÷ 12 = 10,440 ÷ 12 = 870 pieces
- Labour hours = 30 × 10 = 300
- Productivity = 870 ÷ 300 = 2.90 pieces per man-hour
Before overtime, productivity was 780 ÷ (30 × 8) = 780 ÷ 240 = 3.25 pieces per man-hour. Production went up by 90 pieces, from 780 to 870. Productivity went down from 3.25 to 2.90. Overtime also costs more per hour in most places, so the cost per piece rises too. This example shows why a factory should watch productivity and not only production.
Worked example 4: labour cost per piece
Suppose the cost of one operator hour is 150 currency units, including benefits.
- Line A cost per piece = 150 ÷ 2.78 = 54 units
- Line B cost per piece = 150 ÷ 3.00 = 50 units
Line B makes each shirt 4 units cheaper in labour, which is about 7 percent less. On 720 shirts a day, that is a saving of 2,880 units a day. Use your own wage numbers, since these are examples.
The efficiency formula in “time and work” problems
The word efficiency also appears in school maths, in “time and work” problems. There, efficiency means the amount of work a person does in one unit of time. The idea is the same: more work in less time means higher efficiency.
Efficiency is in inverse proportion to time taken.
Worker A can finish a job in 10 days. Worker B can finish it in 15 days.
- A does 1 ÷ 10 = 10 percent of the job per day.
- B does 1 ÷ 15 = 6.67 percent of the job per day.
- Together they do 10 + 6.67 = 16.67 percent per day.
- Time together = 100 ÷ 16.67 = 6 days.
A is 1.5 times as efficient as B, because 15 ÷ 10 = 1.5.
Productivity at a bigger scale
The same idea is used for whole companies and countries. Economists often measure labour productivity as the value of output divided by the number of hours worked. A country whose workers produce more value per hour is said to have higher productivity. This is why a nation with fewer workers can still make more goods than another, if its machines, methods and skills are better. In garments, a factory with newer machines, trained staff and good line balance can make the same shirt with fewer minutes of labour than a factory without them.
Productivity also has a link to wages. Over time, wages can rise without hurting the business only if output per worker rises as well. If wages go up and productivity stays flat, the cost per piece goes up and margins shrink.
A simple daily tracking sheet
You do not need software to begin. A page with a few columns is enough. Fill it at the end of every shift for each line.
| Item | Line 1 example |
|---|---|
| Style and SAM | Polo shirt, 9.5 |
| Operators present | 28 |
| Hours worked | 8 |
| Good pieces made | 760 |
| Defective pieces | 24 |
| Production (good pieces) | 760 |
| Labour hours | 28 × 8 = 224 |
| Productivity | 760 ÷ 224 = 3.39 pieces per man-hour |
| Earned minutes | 760 × 9.5 = 7,220 |
| Available minutes | 28 × 480 = 13,440 |
| Efficiency | 7,220 ÷ 13,440 × 100 = 53.7 percent |
| Defect rate | 24 ÷ (760 + 24) × 100 = 3.1 percent |
After a month, the sheet shows which styles run well, which lines lose minutes and whether overtime is paying for itself. Compare the line with its own history first, since styles and SAM values differ. Our guide on defects vs defectives in garments explains how to count faults the right way.
Why the difference matters in a factory
- Planning. Production targets decide how many pieces to ship. Productivity decides how many people and machines you need to hit the target.
- Costing. Cost per piece depends on productivity, not on the size of production alone.
- Pay and incentives. Rewards tied only to production can push workers to rush and cause defects. Rewards tied to productivity and quality reward smart work.
- Competitive power. Two factories with the same wages can have very different prices if their productivity is different.
- Capacity. A factory with high production but low productivity may be stretched with no room to grow.
See also our article on focusing on wages increment and efficiency improvement equally, and our guide on target vs actual production variance.
Ways to raise productivity without adding people
- Cut non-value-adding time. Waiting, searching, rework and extra movement eat minutes.
- Balance the line. If one operation takes 30 seconds and the next takes 15, the first one is the bottleneck. Move work around or add one operator at the slow step.
- Better methods. Folders, guides and good work aids cut the time of an operation.
- Training. A skilled operator needs fewer seconds per piece. Use skill matrices to place people.
- Machine care. Fewer breakdowns mean fewer idle minutes.
- Right-first-time quality. Defects mean rework, and rework uses labour with no new output.
- Smooth material flow. Bundles should arrive on time and in order.
- Fair incentives. Link rewards to both quantity and quality.
Common mistakes
- Using production as a measure of success. More pieces can mean more people, more overtime and more cost.
- Mixing up efficiency and productivity. A line can have high efficiency on easy styles and still have low productivity if it uses too many operators.
- Ignoring SAM accuracy. If the SAM is wrong, efficiency numbers are wrong.
- Counting defective pieces as output. Only good pieces should be counted.
- Comparing different styles directly. Compare lines using efficiency or earned minutes, not raw pieces.
Final thoughts
Production is the pile. Productivity is the pile per person or per machine hour. Efficiency is how close you came to the standard. A factory that watches only production can fool itself with overtime and extra workers. A factory that watches productivity and efficiency, and checks them against quality, can see the true cost of every piece. Start with a simple line sheet, record operators, minutes and good pieces each day, and let the numbers show you where the minutes are lost.
Frequently asked questions
Production is the total amount made, such as 800 shirts. Productivity is how much is made for each unit of input, such as 3 shirts per man-hour.
Productivity is output divided by input. For labour, it is output divided by labour hours.
Divide the number of good pieces produced by the total labour hours used. If 720 pieces are made with 240 man-hours, productivity is 3 pieces per man-hour.
It is the ratio of earned minutes, which is output times SAM, to the minutes available, shown as a percentage.
Yes. If a factory adds many more workers or works long overtime, production can rise while output per person falls.
No. Productivity is output per unit of input. Efficiency compares actual performance with a standard or target.
Because it shows how well people, machines and materials are used, and it drives the cost per piece.