A dyeing floor’s nameplate capacity, the sum of every machine’s rated batch size, is close to useless as a planning number on its own. Real daily output depends on cycle time, how often machines actually get loaded to their rated capacity, and how much time gets lost to shade changeovers between batches, and a composite knit facility that plans purely off rated capacity consistently overpromises what the floor can actually deliver.
Why Rated Capacity Overstates Real Output
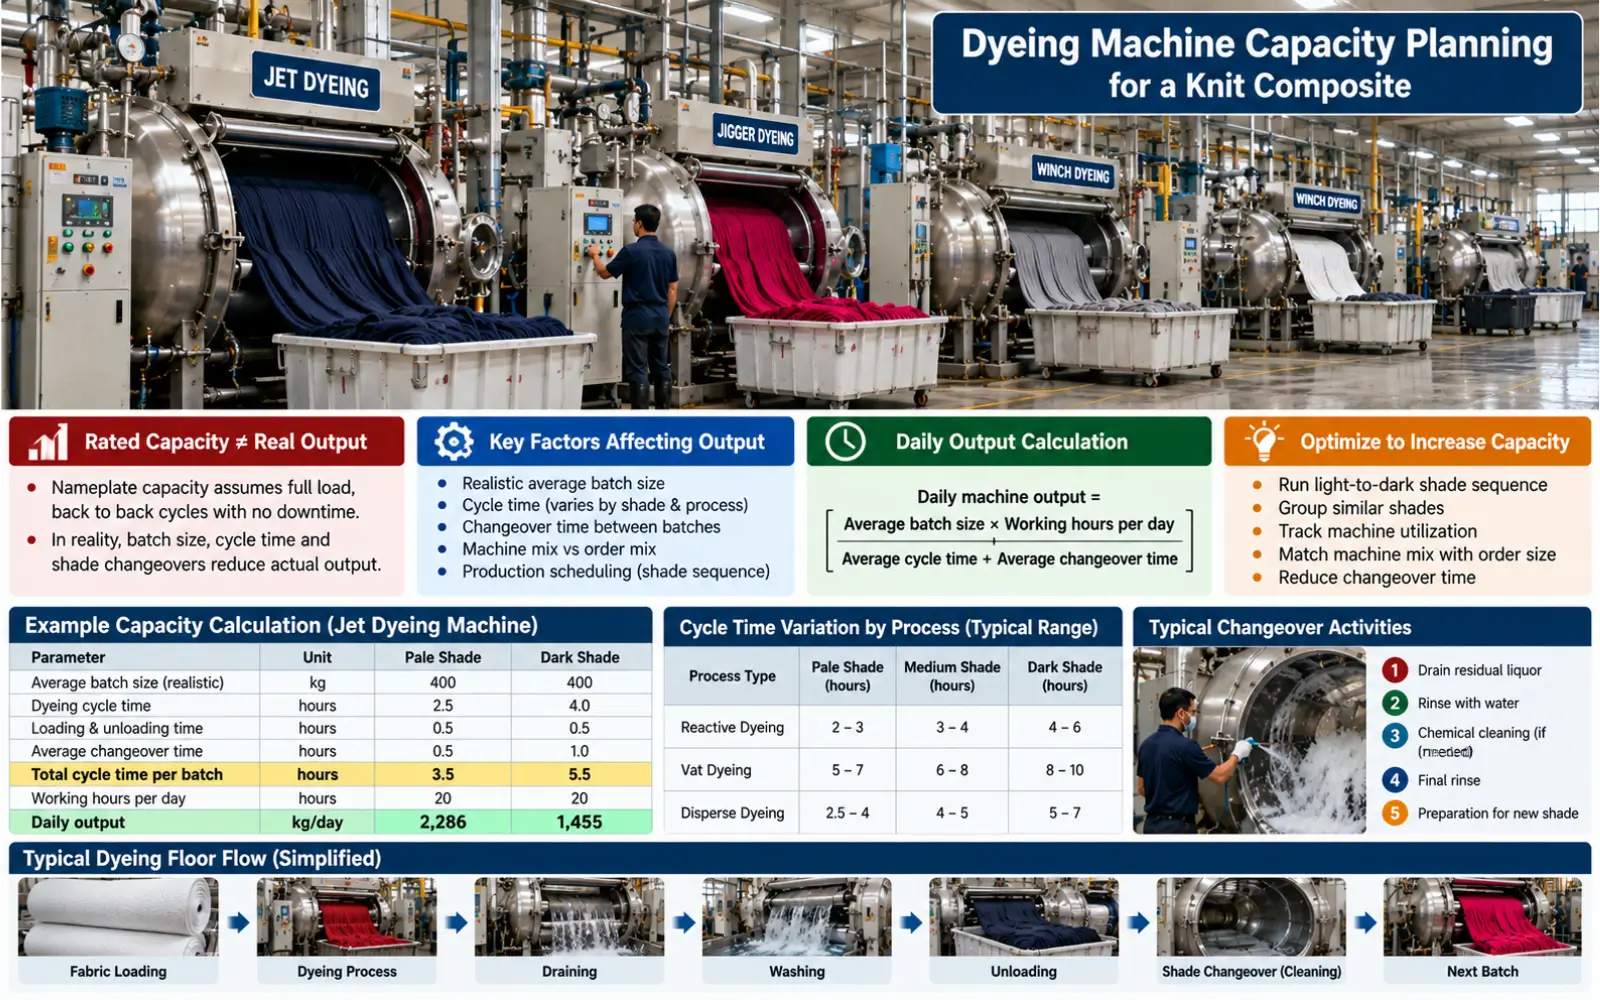
Rated batch capacity assumes a machine dyeing at full load, running back to back with no downtime between batches, every single cycle. Real production never looks like that. Batches run below full rated load when order quantities don’t perfectly match machine capacity, cycle time varies by shade depth and process type, and changeover time between batches, cleaning, and process setup for a new shade or fabric, eats into what looks like available machine hours on a simple capacity spreadsheet.
Building a Real Capacity Model
A realistic capacity model starts with each machine’s actual average batch size achieved in practice, not its rated maximum, since real order patterns rarely fill every machine to full capacity on every cycle. Multiply that realistic average batch size by the number of cycles the machine can actually complete in a working day, which requires knowing average cycle time (including standard process time, loading and unloading, and any waiting time built into the process) plus average changeover time between batches for a representative mix of shade and fabric changes.
Daily machine output = (Realistic average batch size) × (Working hours per day) ÷ (Average cycle time + average changeover time)
Running this calculation for every machine on the floor, then summing across the whole fleet, gives a genuine daily capacity figure that reflects real operating conditions rather than theoretical maximum throughput.
Cycle Time Variation by Process
Cycle time isn’t a single fixed number even for a single machine, since it varies by dye class, shade depth, and fabric type. A pale shade reactive dyeing cycle generally runs faster than a dark shade requiring extended dyeing time to build adequate depth and level dyeing consistency. Vat dyeing, covered in Textile Chemicals guide, generally runs a longer cycle than reactive dyeing given its additional reduction and oxidation process steps. A capacity model that assumes a single average cycle time across all order types will overstate capacity on days weighted toward slower processes and understate it on days weighted toward faster ones, which is why a more accurate model breaks cycle time out by process type where order mix varies meaningfully across a composite’s typical production plan.
Shade Changeover: The Hidden Capacity Drain
Shade changeover time, cleaning a machine thoroughly enough to avoid cross-contamination between an old shade and a new one, sometimes running a cleaning cycle with its own chemical and water cost, represents genuine lost production time that a simple rated-capacity model ignores entirely. A dyeing floor running many small orders across many different shades incurs proportionally more changeover time relative to actual dyeing time than one running fewer, larger orders in consistent shades, and this difference alone can create a meaningful capacity gap between two floors with identical machine counts and rated capacities.
Sequencing batches to minimize changeover, running light-to-dark shade sequences where possible to reduce the intensity of cleaning needed between batches, and grouping similar shades together in the production schedule where order timing allows, genuinely recovers capacity without adding a single machine, which makes production scheduling itself a meaningful lever in capacity planning, not just a downstream execution detail.
Spotting the Machine Mix That’s Quietly Limiting Output
In a mixed fleet, jet, jigger, and winch machines as covered elsewhere, or machines of varying age and liquor ratio technology, the floor’s real capacity is often capped by whichever machine category is most mismatched to the actual order mix coming through, not by the floor’s largest or newest machine. A composite running mostly small, specialty orders but with dyeing capacity weighted toward large-batch machines will see those large machines running under-filled, effectively wasting rated capacity that looks fine on paper but never gets used in practice.
Identifying this requires actually tracking utilization by machine category against real order size distribution, not just tracking overall floor utilization as a single blended number, since a healthy-looking blended utilization figure can hide one machine category running near capacity while another sits chronically underused.
A Worked Capacity Example
Take a single jet dyeing machine rated at 300 kilograms per batch, running a working day of 22 hours (allowing 2 hours for shift changeover and routine daily maintenance). Say this machine’s realistic average batch size, given typical order patterns, runs at 250 kilograms rather than its full rated capacity, and average cycle time for the mill’s typical process mix is 4 hours, with an average changeover time between batches of 45 minutes given the mill’s typical shade sequencing.
Daily output = 250 kg × (22 hours × 60 minutes) ÷ (240 minutes cycle + 45 minutes changeover)
= 250 × 1,320 ÷ 285
= 250 × 4.63
≈ 1,158 kilograms per day from this single machine.
Compare that to a naive rated-capacity estimate that ignores changeover and assumes full batch size: 300 kg × 24 hours ÷ 4 hours = 1,800 kilograms per day, a full 55 percent higher than the realistic figure. Planning production commitments off the naive 1,800 kilogram figure, rather than the realistic 1,158 kilogram figure, would leave this single machine’s daily plan short by more than 600 kilograms every single day, a gap that compounds fast across a multi-machine floor and a multi-week production schedule. Run this same calculation for every machine in your fleet, using your own mill’s actual average batch size, cycle time, and changeover pattern, to build a floor-wide capacity figure you can actually plan production against with confidence.
Using the Capacity Model for Planning Decisions
A properly built capacity model becomes genuinely useful for two kinds of decisions beyond day-to-day scheduling. First, evaluating whether new machine capacity is actually needed, or whether better scheduling and changeover sequencing against the existing fleet would recover enough capacity to meet growing demand without new capital investment. Second, evaluating what type of new machine capacity, if it is genuinely needed, would best match the order mix actually driving the capacity shortfall, rather than defaulting to “buy another machine like the ones we already have” without checking whether the shortfall is actually concentrated in a specific batch size or fabric type category the current fleet underserves.
Connecting Capacity Planning to Order Commitment
A dyeing floor’s real capacity figure, built using the method covered above, has direct value beyond internal production scheduling. It should inform how a mill’s sales or merchandising function commits to delivery dates when quoting new orders. A sales team quoting delivery timelines based on rated capacity, rather than the realistic capacity this article’s method actually calculates, sets up a commitment the production floor can’t reliably hit, creating a recurring source of late deliveries and strained buyer relationships that traces back not to a production execution failure but to a capacity planning gap between what sales believes the floor can do and what it actually can. Sharing the realistic capacity model, and updating it whenever order mix or machine fleet changes as covered above, with whoever is making delivery commitments closes this gap and keeps promised timelines grounded in what the dyeing floor can genuinely deliver, rather than in an optimistic figure nobody has actually verified against real operating conditions.
Revisiting the Model as Order Mix Changes
Like the machine requirement calculation covered in our Garment Machinery guide, a dyeing capacity model isn’t a one-time exercise. Order mix shifts, a move toward smaller, more frequent orders, a new fabric type entering the composite’s product range, a shift toward darker average shades, all change the real capacity figure the model produces, even with the exact same machine fleet in place. Rebuilding the capacity calculation whenever order mix shifts meaningfully, rather than relying on a model built once at initial capacity planning, keeps production planning grounded in what the floor can actually deliver rather than a stale assumption that stopped reflecting reality months earlier.
Capacity Planning as a Cross-Functional Tool
The capacity model covered throughout this article delivers the most value when it’s actually shared and used across the functions that depend on it, not kept as an internal production planning document nobody outside the dyeing floor ever sees. Merchandising and sales teams quoting delivery dates, procurement teams planning fabric and chemical purchasing against production schedules, and finance teams evaluating capacity expansion investment all benefit from working off the same realistic capacity figure this model produces, rather than each function maintaining its own separate, potentially inconsistent assumption about what the dyeing floor can actually deliver. Building the model once and making it a shared reference across these functions avoids the kind of disconnect where sales commits to timelines production can’t hit, simply because each side was working from a different, unreconciled picture of real floor capacity.
Frequently Asked Questions
Why is rated machine capacity misleading for production planning?
Rated capacity assumes full batch loads running back to back with no changeover time, which real production never achieves. The worked example in this article shows realistic capacity can run 55 percent below the naive rated figure.
What’s the biggest hidden drain on dyeing floor capacity?
Shade changeover time between batches, which a simple rated-capacity model ignores entirely but which represents genuine lost production time, especially on floors running many small orders across many different shades.
How often should a dyeing capacity model be rebuilt?
Whenever order mix shifts meaningfully, a new fabric type, a change in average shade depth, or a move toward smaller and more frequent orders, since the original model stops reflecting reality the moment these inputs change.
Should sales teams use rated capacity or realistic capacity when quoting delivery dates?
Realistic capacity, always. Quoting off rated capacity sets up commitments the production floor can’t reliably hit, which shows up as chronic late deliveries traced back to a planning gap, not a production execution failure.