• Skip to main content
  • Skip to secondary menu
  • Skip to primary sidebar
  • Home
  • Textile
    • Textile Calculation
    • Textile Flow Chart
    • Textile Universities
    • Introduction To Spinning
    • Spinning
    • Yarn Manufacturing
    • Yarn Count
    • Abbreviation
    • Template
  • Garments
    • Industrial Engineering (IE)
    • Wet Processing
    • Fabric Cutting
    • Sewing
    • Dyeing
    • Garments Washing
    • Fabric Dyeing and Printing
    • Fabric Spreading
    • Garments
    • Standard Operating Procedure
  • Fashion
  • Merchandising
    • Visual Merchandising
  • Finance
    • Financial Calculation
    • Video Tutorial
    • Economics
    • Economy
  • Career
    • Job Getting Experience
  • Journal

ORDNUR

Textile and Finance

  • About
  • Contact
  • Privacy Policy
  • Terms and Conditions

Statistical and Pareto Analytical Excel Template for Textile and Garments

Statistical and Pareto Analytical Excel Template for Textile and Garments

We are living in the era of 4th industrial revolution where we have to work with big data, that’s why we prefer to work with data analytic. Now a days Statistical and Pareto Analysis is used in every industry to reduce defect. It is one of the most popular tools of 7 QC. Statistical and Pareto Analytical Excel Template will give you easiest solution for your textile and garments. For your convenience we developed a Microsoft Excel data sheet where you can analysis your data in a way that will help you through sorting your data year to year, month to month, and week to week. In addition to these excel will arrange Pareto Chart automatically.

Pareto Chart of Fabric DefectsTwo templates are given here for your experience.

  1. Fabric Defect statistical and Pareto analysis

  2. Sewing Quality statistical and Pareto analysis

Sewing Quantity and RejectsStatistical and Pareto Analytical Excel Template for Textile and GarmentsThese templates can be used for any industry. You can get this template for free. All you need to do is to download and use accordingly.

Stitch Control ChartThese excel templates includes:

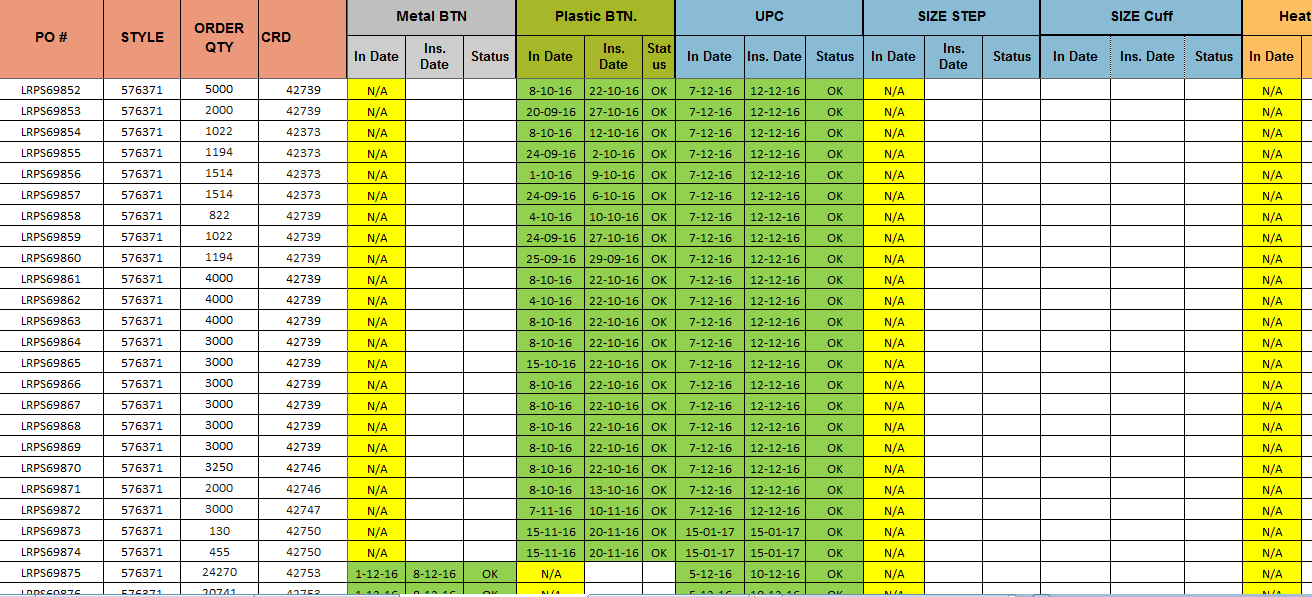
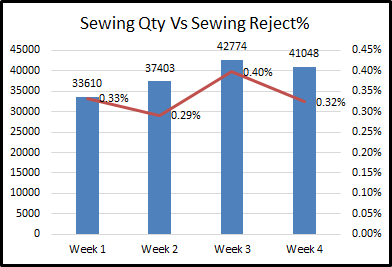
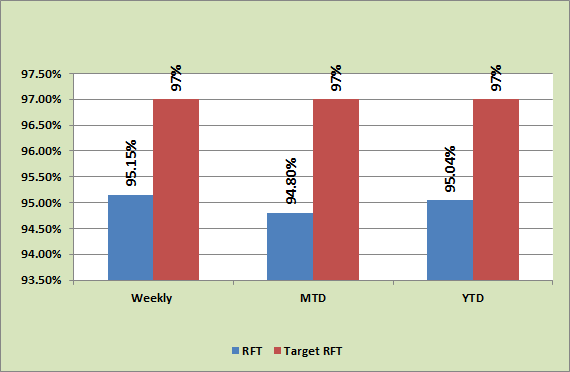
  • Statistical Analysis
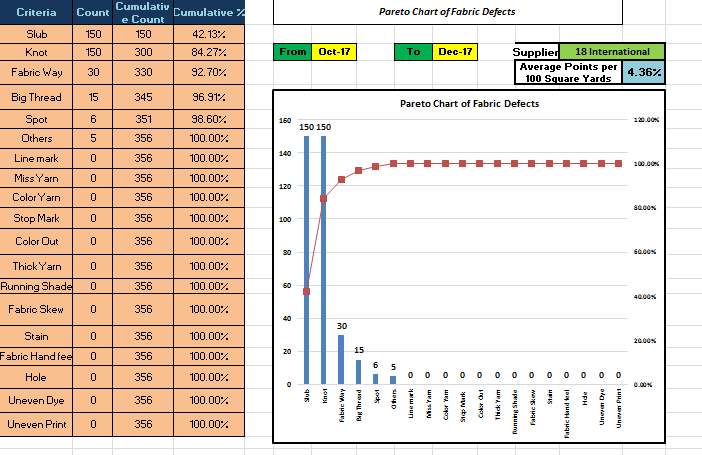
  • Pareto Analysis
  • Pareto Chart
  • Data Sorting

Hope these will be helpful for you to bring work efficiency. If you have any confusion or want to develop these types of data sheet for your company then please do not hesitate to contact with me.

Written by

A.M. Amirul Islam (Washim)

Facebook: Amirul Islam Washim

Phone: +8801929643301
E-mail: [email protected]

If you like this article please do not forget to share on facebook and put your valuable comment.

Share this:

  • Email
  • Print
  • WhatsApp

Related

Filed Under: Template

Reader Interactions

Leave a Reply Cancel reply

Your email address will not be published. Required fields are marked *

Primary Sidebar

All Post

TOP ARTICLES

  • Standard Minute Value: SMV in Garments, Calculation, Importance
  • Garments Quality SOP [updated]
  • 6 Core Principles of Finance You Should Know [2020]
  • Implementation of 5S in Apparel Industry
  • Different Parts of Jeans Pant
  • 24 Types of Denim Manufacturing Process [2019]
  • Quality Control Manual of Garments
  • GPQ Job Responsibilities in Apparel Industry
  • Job Responsibilities of Quality Manager in Apparel Industry
  • Cutting Section SOP in Garments Industry

Subscribe Us

Join 109 other subscribers

Contact

Copyright © 2019 ORDNUR

loading Cancel
Post was not sent - check your email addresses!
Email check failed, please try again
Sorry, your blog cannot share posts by email.