
Why does a style look fresh one season and tired the next? Why did wide-leg jeans vanish, then return? The fashion cycle is the pattern behind it. It describes how a style is born, spreads, peaks and fades, and understanding it helps designers, merchandisers, buyers and shoppers make better decisions.
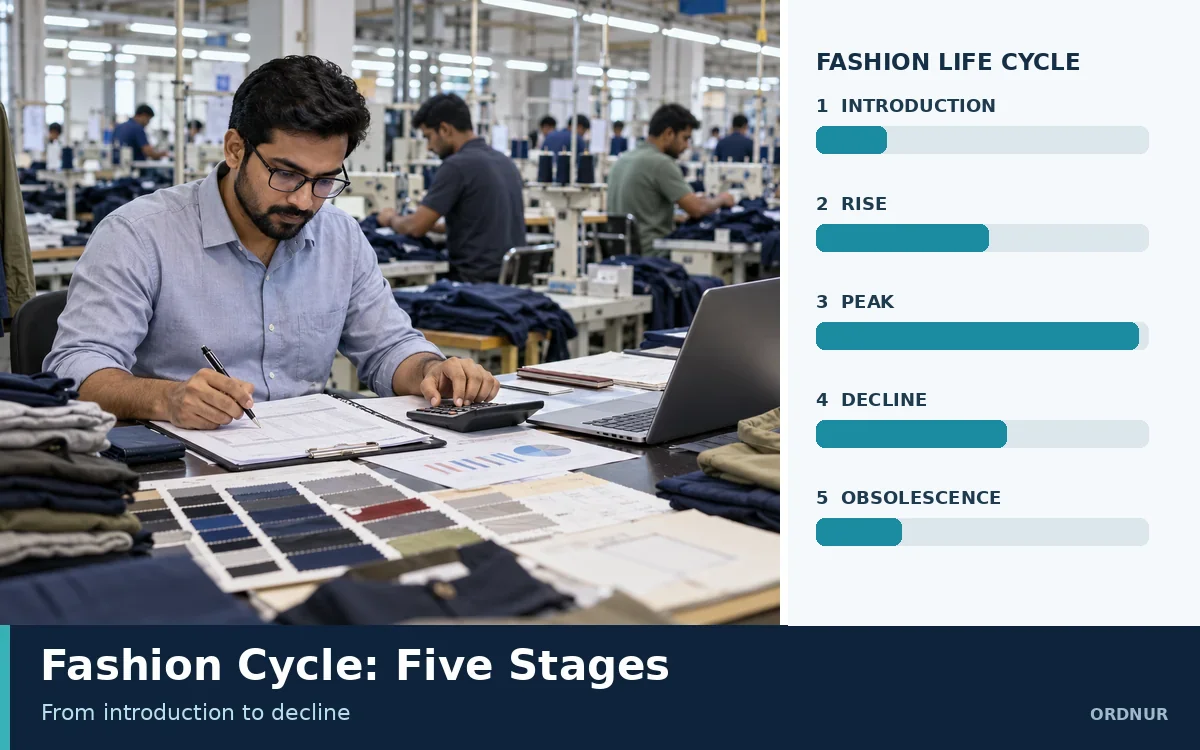
This guide explains the fashion cycle in plain words. You will see the five stages, the difference between a fad, a trend and a classic, how different groups of people pick up a style, and what it means for a garment factory with real lead times. There is also a worked 12-week sales example so you can see the curve in numbers and learn when to mark prices down.
What is the fashion cycle?
The fashion cycle is the life of a style, from its first appearance to its disappearance from the market. If you plot sales of one style over time, you often get a bell-shaped curve. Sales start slow, rise, reach a peak, then drop.
It applies to a single item like a crop jacket, a colour like sage green, a silhouette like baggy trousers, or a whole look. The shape is similar, but the length changes. One style may last a few weeks and another may last for years.
The five stages
1. Introduction
A new style appears. Designers show it on the runway, a brand launches it in a small collection, or a few street-style leaders start wearing it. Few people have it, prices are high and stock is small. Media and social posts start to talk about it.
2. Rise
More people notice the style. Other brands copy or adapt it. Prices fall as production grows and more shops stock it. Sales climb fast. This is the stage where good forecasting pays off, because a merchandiser who spots the style early can place orders before demand outruns supply.
3. Peak (culmination)
The style is everywhere. Mass-market stores sell it at a wide range of prices. Sales are at the highest point. Many people who wanted the look already have it. The risk now is over-ordering, because the market is close to being full.
4. Decline
Interest fades. Fashion leaders move on to new looks and the style feels common. Sales slow and stock starts to sit. Retailers cut prices to clear it.
5. Obsolescence
The style is seen as old. Sales are very low, and it is sold only in clearance or discount shops. Some styles stay dead. Others return years later in a new form, which starts a new cycle.
| Stage | Sales | Price | Who buys | Retailer’s job |
|---|---|---|---|---|
| Introduction | Low | High | Fashion leaders | Test small quantities |
| Rise | Growing fast | Falling | Early adopters and followers | Reorder and expand |
| Peak | Highest | Lowest at full price | Mass market | Control stock, avoid overbuying |
| Decline | Falling | Markdowns | Bargain seekers | Clear stock, plan the next style |
| Obsolescence | Very low | Clearance | Few | Remove from range |
Fad, trend and classic
Not all styles follow the same curve.
| Type | Life span | Curve shape | Example idea |
|---|---|---|---|
| Fad | Weeks to a season | Steep rise and a steep drop | A novelty print or a single viral item |
| Trend | A few seasons to a few years | Gradual rise, long peak, slow decline | A silhouette or colour that sticks around |
| Classic | Many years | Long and flat, with small ups and downs | The white shirt, blue jeans, a plain T-shirt |
A fad can be profitable if you are quick and keep stock low. A trend is the best target for most brands. A classic is the safe base of a range and sells steadily, though it rarely creates excitement.
Our guide on what is fashion forecasting shows how teams try to tell which one a new style will be.
Who adopts a style, and when?
People take up new styles at different speeds. A common model, from the study of how new ideas spread, splits buyers into five groups.
| Group | Share of buyers | Behaviour |
|---|---|---|
| Innovators | 2.5% | Try new styles first, often before shops stock them |
| Early adopters | 13.5% | Follow the innovators, set the look for others |
| Early majority | 34% | Wait until the style looks safe |
| Late majority | 34% | Buy when most people already have it |
| Laggards | 16% | Buy last, or only when the style is a classic |
The shares add up to 100 percent (2.5 + 13.5 + 34 + 34 + 16). If a style could reach 10,000 buyers over its life, the numbers would be 250, 1,350, 3,400, 3,400 and 1,600. The early group is small, but its choices decide what the majority sees.
Three ways a style spreads
- Trickle down. A style starts with wealthy or high-fashion customers and moves down to lower price points. Think of a luxury design copied by a mass brand.
- Trickle up. A style starts on the street, in youth or subculture groups, and rises into high fashion. Our piece on streetwear trends in youth fashion shows an example of this.
- Trickle across. A style moves across groups at the same level at the same time, helped by media and social networks.
Today social media speeds up all three, and cycles look shorter than in the past.
A worked example: a 12-week sales curve
Let us follow one T-shirt style through its life at a retailer. The numbers are an example, but the maths is real.
Weekly unit sales
| Week | Units | Cumulative | Cumulative % |
|---|---|---|---|
| 1 | 50 | 50 | 1.8% |
| 2 | 120 | 170 | 6.1% |
| 3 | 260 | 430 | 15.5% |
| 4 | 420 | 850 | 30.7% |
| 5 | 520 | 1,370 | 49.5% |
| 6 | 480 | 1,850 | 66.8% |
| 7 | 360 | 2,210 | 79.8% |
| 8 | 240 | 2,450 | 88.4% |
| 9 | 150 | 2,600 | 93.9% |
| 10 | 90 | 2,690 | 97.1% |
| 11 | 50 | 2,740 | 98.9% |
| 12 | 30 | 2,770 | 100.0% |
Total sold = 2,770 units. The peak week is week 5, with 520 units.
Step 1: Match the weeks to the stages
| Stage | Weeks | Units | Share of total |
|---|---|---|---|
| Introduction | 1 to 2 | 170 | 6.1% |
| Rise | 3 to 4 | 680 | 24.5% |
| Peak | 5 to 6 | 1,000 | 36.1% |
| Decline | 7 to 9 | 750 | 27.1% |
| Obsolescence | 10 to 12 | 170 | 6.1% |
Check: 170 + 680 + 1,000 + 750 + 170 = 2,770.
The peak stage, only two weeks, brings in 36.1 percent of all sales. That is why stock at the right time matters so much.
Step 2: Set a pricing plan
- Weeks 1 to 6: full price of 20 dollars
- Weeks 7 to 9: 30 percent off, so 14 dollars
- Weeks 10 to 12: 50 percent off, so 10 dollars
Step 3: Revenue
- Weeks 1 to 6: 1,850 units × 20 = 37,000
- Weeks 7 to 9: 750 units × 14 = 10,500
- Weeks 10 to 12: 170 units × 10 = 1,700
- Total revenue = 49,200 dollars
Step 4: Average price
Average realised price = 49,200 ÷ 2,770 = 17.76 dollars. That is about 11 percent under the full price of 20 dollars. (20 − 17.76 = 2.24, and 2.24 ÷ 20 = 11.2 percent.)
Step 5: Margin
If each shirt costs 8 dollars to buy, the gross margin on the units sold = (17.76 − 8) ÷ 17.76 = 55 percent on average. Full-price weeks earn a 60 percent margin ((20 − 8) ÷ 20). The 50-percent-off weeks earn only 20 percent ((10 − 8) ÷ 10). That is the cost of selling late in the cycle.
What the example teaches
- The style earned most of its money in six weeks.
- Markdowns in the decline stage cut the average price but still cleared stock above cost.
- If the retailer had bought far more than 2,770 units, the extra pieces would have sold only at the lowest prices, or not at all.
- If the retailer had run out of stock in weeks 4 to 6, it would have lost sales at full price.
What the fashion cycle means for a garment factory
For a buyer in the shop, the cycle is a retail story. For a factory, it means pressure on lead time and order size.
- Short windows. If a style peaks in a few weeks, a late shipment can miss the peak. Buyers may cancel or ask for a discount.
- Smaller, faster orders. Brands often place a small first order and then reorder if the style takes off. Factories need flexible lines and quick material sourcing.
- Material planning. Fabric, trims and accessories must be ready on time. A clear bill of materials saves days.
- Sampling speed. Fast sampling and approvals help brands test a style before the rise stage.
- Risk sharing. Merchandisers need to talk with buyers about who carries the risk of unsold stock. See the responsibilities of an apparel merchandiser.
The faster cycle also has a cost to the planet. Cheap, quick styles that go out of fashion in weeks lead to more waste. Read our page on fast fashion’s environmental impact for more on this.
How to spot where a style is in the cycle
| Clue | Early stage | Late stage |
|---|---|---|
| Where you see it | Runways, niche shops, social media leaders | Every mass-market store |
| Price | High, small runs | Low, large runs, markdowns |
| Copies | Few | Many versions at every price |
| Media talk | New, exciting | Already “over” |
| Sales speed | Slow but growing | Slowing or falling |
For retail shops, a visual merchandising plan can move a style to the front when it is rising and to the back when it fades.
Common mistakes to avoid
- Reading a fad as a trend. A style that sells out in two weeks can look like a lasting winner. Buying deep on that signal leaves you with stock when the drop comes.
- Waiting for proof. The opposite error is to wait until everyone is sure. By then the rise is over and the peak is short.
- Ignoring the shape. Total sales hide the story. Two styles can sell 2,770 units, one over 12 weeks and one over 40, and they need very different plans.
- Late markdowns. Prices cut after the decline is clear earn less than prices cut at the first slowdown.
- Copying without a plan. Following a trend at the peak means competing with every other brand, at the lowest prices.
Tips for merchandisers and small brands
- Start with a small test batch and watch weekly sales.
- Track the shape of the curve, not only the total.
- Keep some capacity free for fast reorders.
- Plan markdowns before the decline starts, not after.
- Mix fads, trends and classics in each season’s range.
- Keep notes from each season so you can learn which styles lasted.
Final thoughts
The fashion cycle runs from introduction to rise, peak, decline and obsolescence. Fads are quick, trends last longer and classics stay. Different groups adopt a style at different times, and a few early buyers shape what the majority sees later. Our 12-week example showed 36 percent of sales in just two peak weeks and an average price about 11 percent under the list price after markdowns.
Whether you run a brand, plan orders at a factory or simply like clothes, the lesson is the same. Know where a style sits on the curve, and match your stock, price and timing to it. No forecast is perfect, but watching the curve gives you a head start.
Frequently asked questions
It is the life span of a style, from its launch to its fade from the market. It usually follows a bell-shaped sales curve.
Introduction, rise, peak, decline and obsolescence.
A fad is short and sharp. A trend lasts a few seasons or years. A classic stays in fashion for a long time with only small changes.
It varies. A fad may last weeks, a trend a few years, and a classic many years. Social media tends to shorten the cycle.
They are the small group, around 2.5 percent of buyers, who try new styles first. Early adopters follow them, then the majority.
It helps them time orders, set prices and plan markdowns so they do not run out of stock at the peak or hold too much stock at the end.
Yes. Old styles often return in new forms, which starts a new cycle.