
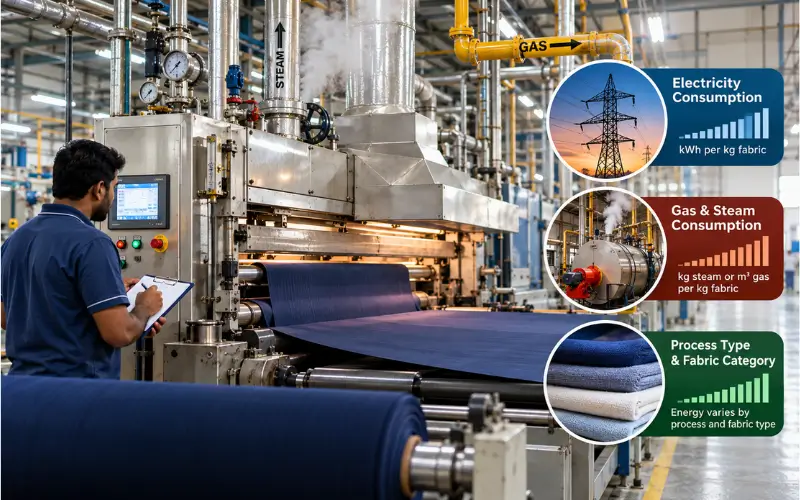
Published energy benchmarks for textile processing carry a wider range than most people expect the first time they actually look at the literature, and that range itself is informative. It tells you that “energy consumption per kilogram of fabric” isn’t a single number the industry converges on, it’s a figure that depends heavily on process type, machine technology, and fabric category, which means the right way to use a benchmark is as a directional check against your own mill’s specific process mix, not a single target every mill should hit regardless of context.
A Note on Using Published Benchmarks Responsibly
Before looking at specific figures, it’s worth being upfront about how widely these numbers vary across published studies. Specific energy consumption (SEC) figures for textile wet processing in the academic and industry literature range from well under one kWh per kilogram of fabric in some studies to considerably higher in others, depending heavily on what’s actually being measured, whether the figure covers wet processing alone or the full production chain from spinning through finishing, what fabric and fiber types are included, and what machine technology the studied facilities were running. Treat any single figure, including the ones below, as one data point within a genuinely wide published range, and prioritize benchmarking against your own mill’s historical performance over time as the more actionable comparison once you have a baseline established.
Electricity Consumption Benchmarks
Textile wet processing electricity consumption in published studies commonly falls in a range from under half a kWh per kilogram of fabric in more efficient, modern operations, up to several kWh per kilogram in less efficient or older facility configurations, with the wide spread reflecting real differences in machine age, process type, and fabric category as much as differences in measurement methodology between studies. Wet processing (dyeing and finishing specifically) generally shows meaningfully lower specific electricity consumption than fiber and yarn production stages like spinning, which are more electricity-intensive relative to their output weight, an important distinction when comparing a benchmark figure to make sure it’s actually measuring the same production stage your mill is trying to compare against.
Gas and Steam Consumption Benchmarks
Thermal energy consumption, covering gas or other fuel used to generate the steam that drives dyeing, drying, and finishing, represents a substantial share of total energy use in wet processing, often exceeding electricity’s share of total energy cost given how thermally intensive dyeing and drying processes are. Published figures for thermal energy consumption in textile wet processing, when expressed per kilogram of fabric, also show considerable range across studies and facility types, reinforcing the same point above: process type, machine technology (particularly liquor ratio, covered in Processing Machinery guide), and fabric category all drive real, substantial differences in what a specific mill should reasonably expect to consume.
The IFC PaCT Benchmarking Program
For Bangladesh specifically, the IFC Partnership for Cleaner Textile (PaCT) program has run structured benchmarking studies across the country’s textile wet processing sector, assessing water, energy, and chemical consumption across a substantial sample of participating facilities. This kind of program-based benchmarking, drawing on a large sample of facilities within the same regulatory and market context a Bangladeshi mill actually operates in, generally gives a more directly relevant comparison point than pulling figures from international academic literature covering facilities in entirely different markets, fabric mixes, and machine generations. Mills interested in benchmarking against current PaCT program findings should look for the most recent published PaCT benchmarking reports directly, since program findings get updated periodically as more facility data becomes available and as the sector’s average machine technology continues to shift.
Where Real Mill Performance Tends to Diverge From Benchmarks
A few consistent patterns show up when comparing individual mill performance against published benchmark ranges. Mills running predominantly older machine technology, higher liquor ratio dyeing equipment particularly, tend to sit toward the higher end of published consumption ranges, sometimes well above what modern, low liquor ratio equipment achieves on comparable fabric. Mills with a fabric mix weighted toward darker shades and more processing-intensive fabric types tend to run higher consumption than a mill weighted toward lighter shades and simpler processes, an important context to establish before concluding a mill is underperforming relative to a generic benchmark that doesn’t account for its specific product mix. And mills without an established program of the maintenance-level efficiency measures covered elsewhere, steam trap surveys, insulation condition, compressed air leak management, tend to run higher actual consumption than their machine technology alone would predict, since these maintenance-layer losses add real consumption on top of whatever a facility’s core process technology would otherwise achieve.
Comparing Benchmark Sources Honestly
Different published benchmark sources sometimes report figures that appear to conflict with each other, and understanding why matters more than trying to identify a single “correct” number among them. Academic studies often draw on a specific, sometimes small sample of facilities that may not represent the broader industry’s typical performance. Industry program benchmarks like IFC PaCT draw on a larger, more geographically and technologically relevant sample for a specific market, but still average across a genuinely diverse range of mill sizes, ages, and process mixes. Vendor-published figures, where a machinery or chemical supplier cites an efficiency benchmark, deserve particular scrutiny given the natural incentive to present figures favorable to whatever the vendor is selling.
None of this means benchmark figures are unreliable or not worth consulting, it means they should be read as evidence from a specific context rather than a universal truth, and a mill drawing on multiple sources, comparing where they roughly agree and understanding why they might diverge where they don’t, builds a more reliable picture than anchoring on a single source’s figure as the definitive target.
Metering: The Prerequisite Most Mills Skip
Every benchmark comparison in this article assumes a mill can actually measure its own consumption per kilogram with reasonable accuracy, and that assumption doesn’t hold universally. A mill billed on a single combined electricity meter for the entire facility, without sub-metering by process area or machine category, can only calculate a blended, facility-wide energy-per-kilogram figure, which mixes wet processing consumption with cutting room, sewing floor, and general facility power in a way that makes any comparison against a wet-processing-specific benchmark unreliable. Investing in sub-metering, even relatively basic clamp-on or panel-level metering covering the major utility-consuming process areas separately, is often the actual prerequisite for any of the benchmarking guidance in this article to be genuinely useful, rather than a nice-to-have refinement layered on top of benchmarking that’s already happening effectively. A mill without this metering in place should treat installing it as the practical first step before investing further effort in benchmark comparison, since comparing an inaccurate or overly blended consumption figure against an external benchmark risks drawing the wrong conclusion in either direction.
Building Your Own Baseline
Given how much published benchmarks vary and how many mill-specific factors drive real consumption, the most useful application of this article isn’t picking a single target figure from the ranges above and treating it as a hard goal. It’s establishing your own mill’s actual current consumption per kilogram, broken down by process type and machine where your metering allows, and using that as the baseline against which future efficiency investments get measured. Compare that baseline against published ranges as a sanity check, is your mill roughly within a reasonable range for its process mix and machine age, or meaningfully outside it in a way that suggests a real efficiency opportunity, but treat your own trend over time, not a one-time comparison against an external figure, as the metric that actually drives good decisions about where to invest in efficiency improvements next.
Frequently Asked Questions
What’s a typical energy consumption figure for textile wet processing?
Published figures vary widely, from under half a kWh per kilogram in efficient modern operations to several kWh per kilogram in less efficient facilities, which is why a single universal benchmark figure should be treated cautiously.
Why do published energy benchmarks vary so much between sources?
Differences in process type, machine technology, fabric category, and what production stage is actually being measured all drive real variation, not just inconsistent measurement methodology between studies.
What does a mill need before it can benchmark its own energy performance?
Sub-metering by process area or machine category, not just a single facility-wide electricity bill, since a blended figure mixing wet processing with cutting, sewing, and general facility power can’t be compared meaningfully against a process-specific benchmark.
Is the IFC PaCT program a reliable benchmark source for Bangladeshi mills?
Yes, generally more directly relevant than international academic literature, since it draws on a large sample of facilities within the same regulatory and market context a Bangladeshi mill actually operates in.