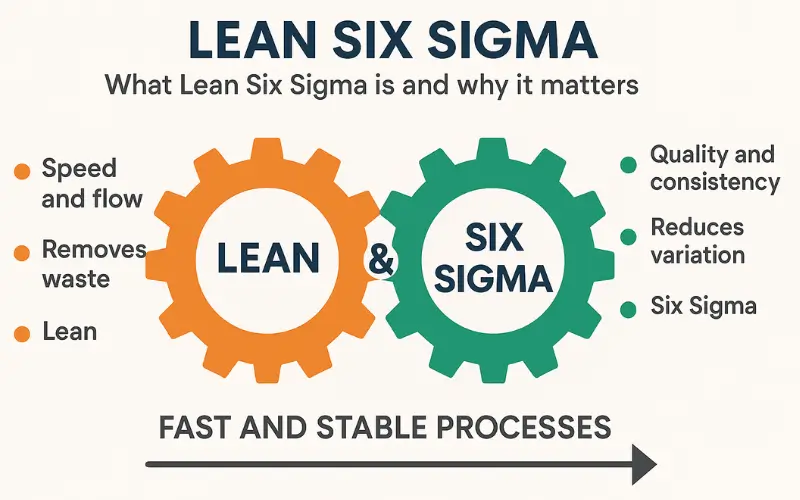
Lean Six Sigma is a practical way to build processes that are fast and consistently correct. Lean removes waste and makes work flow. Six Sigma reduces variation with data and the DMAIC method. When you combine them, you get shorter lead time, fewer errors, and lower cost in factories, hospitals, banks, and IT teams.
Lean comes from the Toyota Production System with ideas like just in time and jidoka. These ideas turned into five principles: define value, map the value stream, create flow, establish pull, pursue perfection. Six Sigma adds a structured path to improvement with DMAIC which stands for Define, Measure, Analyze, Improve, Control. It aims for very low defects which people often summarize as about 3.4 defects per million opportunities.
Lean vs Six Sigma vs Lean Six Sigma
| Aspect | Lean | Six Sigma | Lean Six Sigma |
| Primary aim | Speed and flow by removing waste and delays | Predictability by reducing variation and defects | Flow first, then reduce variation |
| Core logic | Five principles: value, value stream, flow, pull, perfection | DMAIC: Define to Control | Lean to simplify, Six Sigma to stabilize |
| Typical tools | VSM, 5S, Kanban, SMED, Kaizen, Jidoka | MSA, SPC, capability Cp Cpk, Pareto, regression, DOE | Pick both sets to fit the problem |
| Best use | Long lead times, queues, rework, hand offs | High defect rates, unstable output, missed specs | End to end transformation with speed and quality |
A short history and the core ideas
• Toyota Production System inspired Lean with just in time and jidoka.
• Motorola and GE popularized Six Sigma using DMAIC and capability improvement.
Lean fundamentals you must know
The five principles with quick service examples
- Specify value from the customer.
- Map the value stream and remove non value added steps.
- Create flow so work moves without waiting.
- Establish pull so you make only what is needed.
- Pursue perfection with daily improvement.
Example: in a clinic, map patient flow, remove duplicate forms, and schedule based on demand.
Essential Lean tools and what they solve
Value Stream Mapping VSM: Shows material and information flow so you can see bottlenecks and waste.
5S: Organizes the workplace to cut motion and searching time.
Kanban pull: Matches work to demand and limits WIP to reduce queues.
SMED: Short changeovers mean smaller batches and smoother flow.
Kaizen and Jidoka: Daily improvement and stop to fix when an abnormality appears.
Six Sigma fundamentals you must know
DMAIC in practice
Define: Write a charter, scope well, and set goals linked to CTQs.
Measure: Validate the measurement system with MSA and capture a baseline.
Analyze: Use Pareto, fishbone, hypothesis tests, and regression to find root causes.
Improve: Pilot fixes, use DOE to tune key factors, and add error proofing.
Control: Create a control plan, choose the right SPC chart, and train the team.
Roles and belts
Yellow, Green, Black, and Master Black Belt match project complexity. Champions sponsor projects and review tollgates.
Measurement and capability
MSA or Gage R and R: Make sure the data are trustworthy before you analyze.
SPC or Control Charts: Tell apart common cause and special cause. Choose charts by data type like X bar R, I MR, p, u.
Process capability Cp Cpk Pp Ppk: Show how well a stable process meets specs. Higher Cpk usually means fewer defects.
Sigma levels and DPMO: Six sigma performance is a handy label for very low defect rates which people summarize as about 3.4 DPMO.
Lean and Six Sigma together
First, simplify the process with Lean so work flows. Next, stabilize it with Six Sigma so results hit CTQs. If you try to stabilize a broken flow, you waste effort. If you push flow without fixing variation, the gains do not last.
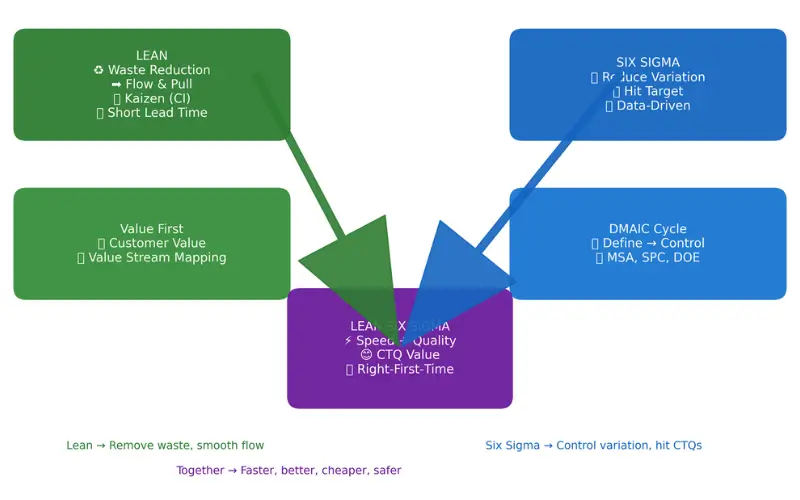
[Integration diagram: Lean gives speed and flow. Six Sigma gives quality and consistency. Together you get fast and stable processes.]
Real world applications across industries
Healthcare:
- Cut ER or OPD waits by mapping value streams and rebalancing work steps.
- Reduce lab or reporting errors with MSA, SPC, and a control plan.
Banking and Fintech:
- Streamline KYC and onboarding steps and remove rework.
- Improve alert precision and reduce false positives with validated data and simple models.
Logistics and Retail:
- Shorten picking and packing lead time and reduce WIP.
- Stabilize accuracy and shrinkage with root cause analysis and controls.
IT and Services:
- Remove hand offs and queues in incident and change workflows.
- Reduce recurrence and response variability with SPC and control plans.
Implementation playbook
Step 1. Pick the right problem and scope it well
- Write a clear charter with SMART goals and boundaries.
- Translate Voice of Customer into measurable CTQs.
- Build a SIPOC and align on scope and success criteria.
Step 2. See the work
- Map the value stream and find queues and waste.
- Create a data plan and perform MSA or Gage R and R.
- Capture a baseline for defect rate, lead time, and capability.
Step 3. Find root causes
- Use Pareto and fishbone to focus your investigation.
- Run hypothesis tests and regression to verify drivers.
- Use screening DOE when many factors may interact.
Step 4. Fix and pilot
- Run kaizen events for fast barriers. Use DOE to tune settings.
- Add poka yoke, standard work, and checklists.
- Pilot the solution and compare before and after results.
Step 5. Lock it in
- Create a control plan and choose the right SPC chart.
- Update SOPs, training, and visual management.
- Define a response plan for out of control signals.
DMAIC checklist
• Define: charter complete, VOC to CTQ translated, SIPOC agreed, SMART goal set.
• Measure: data plan approved, MSA passed, baseline metrics captured.
• Analyze: root causes verified with data and the vital few drivers confirmed.
• Improve: solutions piloted, risks mitigated with FMEA, benefits quantified.
• Control: control plan active, SPC monitoring in place, ownership assigned.
Important Six Sigma tools
| Tool | What it does | When to use it |
| SIPOC or Process Mapping | Scopes the process and aligns stakeholders. | Define |
| MSA or Gage R and R | Validates measurement precision and accuracy. | Measure, before analysis |
| SPC or Control Charts | Monitors stability and separates common and special cause. | Control and baseline in Measure |
| Capability Cp Cpk Pp Ppk | Quantifies fit to spec limits. | After stability is confirmed |
| Pareto 80 or 20 | Focuses effort on the vital few categories. | Analyze |
| Cause and Effect fishbone | Structures potential causes. | Analyze before testing |
| Hypothesis Testing | Compares means, proportions, or variances. | Analyze |
| Correlation and Regression | Quantifies and predicts relationships. | Analyze and Improve |
| Design of Experiments DOE | Tests factors and interactions and optimizes settings. | Improve |
| FMEA | Prioritizes risks by severity, occurrence, and detection. | Improve and Control |
| 5 Whys | Drills down to root causes. | Analyze |
| Poka Yoke or Error Proofing | Prevents mistakes or makes them obvious. | Improve and Control |
Certification guide
Belts and roles: Yellow is foundations. Green leads scoped projects. Black leads complex cross functional work. Master Black Belt drives programs and coaching. Bodies include ASQ, IASSC, and university programs. Review each exam blueprint and sample questions before you decide.
Which belt first?
- Yellow if you are new or supporting projects.
- Green if you will lead scoped improvements.
- Black if your role needs cross functional change and advanced analytics or DOE.
A simple study plan for Green Belt is 8 to 12 weeks. Focus on DMAIC deliverables, chart selection, capability indices, MSA basics, Pareto and fishbone, and an intro to regression and DOE. Practice with past papers and a real project.
Metrics and how to sustain gains
- Speed and flow: lead time, cycle time, WIP, on time delivery.
- Quality and capability: first pass yield, defect rate or DPMO, Cpk or Ppk, and stability via SPC.
- Business impact: cost of poor quality, customer satisfaction or NPS, safety and compliance.
- Governance: a project hopper, tollgates, weekly visual reviews, and executive steering.
Emerging trends
- Lean Six Sigma with digital tools like process mining, automated data capture, cloud dashboards, and machine learning for root cause hints.
- Growth in services and government, especially in healthcare.
Conclusion
Use Lean to simplify and speed up the work. Then use Six Sigma to control variation and keep results on target. This mix delivers performance that is faster, better, and more reliable. It is also what certification exams and hiring managers want to see.
Author: Salauddin Ahamed Sagar