The cryptocurrency market is always open. Knowing what to watch out for and how to filter through the noise is challenging because traders are continually producing data. Indicators give traders tools for data simplification and pattern recognition, enabling them to make favorable trade decisions.
The Moving Average Convergence/Divergence (MACD) indicator has become an increasingly popular cryptocurrency trading tool since it is straightforward, capable of producing reliable trading signals, and simple enough for even the most novice investors to understand.
Let’s explore the MACD’s performance and how you might use it to evaluate the intensity and direction of trends.
Explaining MACD Indicator
Moving Average Convergence Divergence, or MACD is a technical analysis indicator frequently used in trading to spot changes in the strength, direction, and momentum of a cryptocurrency’s price trend.
Gerald Appel, who also thought of a barcode, created it in the later part of the 1970s. Since then, it has found use in financial markets like cryptocurrency, forex, and stock markets.
How does MACD function?
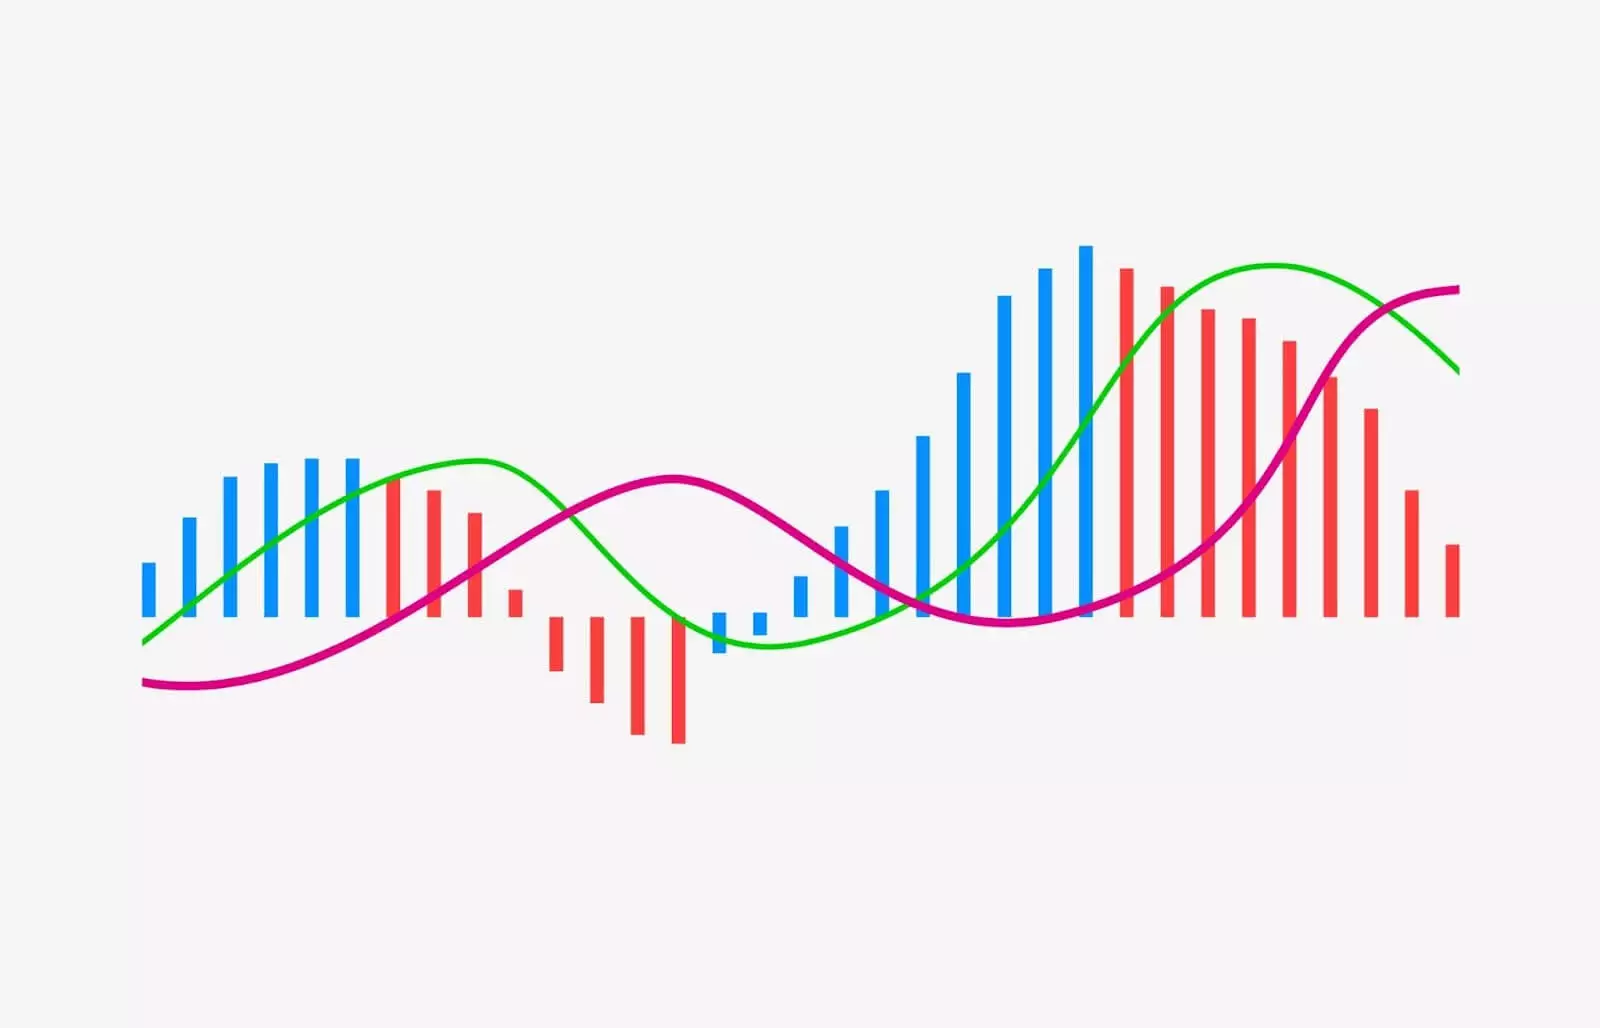
The MACD indicator is created by two exponential moving averages (EMAs) with different time periods, which are then represented by the difference between the MACD line and the signal line.
The MACD line is a technical analysis technique that draws a blue line that indicates price movements using two exponential moving averages. The computation consists of subtracting the 12-period exponential moving average from the 26-period exponential moving average, and the result is represented on the chart with a signal line.
The signal line is the MACD line’s 9-period EMA. It is regarded as a bullish indication when the MACD line crosses above the signal line, and a bearish signal when the MACD line crosses below the signal line. This might be used to predict the Bitcoin or BTC price in the future and serve as a signal to buy or sell.
There is also the MACD histogram, which is produced using the deviations between two other lines. The zero line is the central line that the histogram and its friends oscillate above and below.
How do crypto traders use the MACD indicator?
There are several effective ways to read the signals from the MACD indicator in order to understand what’s happening with the market and when it might change direction.
Signal Line Crossover
As the name implies, this method is based on the relationship between the signal line and the main MACD line. A trend reversal is likely to occur when the MACD’s signal line crosses over its moving average.
A bullish crossover occurs when the short-term moving average crosses above the long-term moving average. A bearish crossover occurs when the short-term moving average crosses below the long-term moving average.
Zero Line Crossover
A MACD line crosses the zero level in this signal as well, just like it did in the prior one. It signals a bullish trend when it changes from negative to positive. Moreover, MACD indicates a bearish trend when it crosses below the zero line and turns negative.
Bullish and bearish divergence
A divergence occurs when the MACD line is moving in one direction while the price of a cryptocurrency is moving in another. It can indicate a trend’s impending reversal or a change in price direction. By comparing the price trend to the MACD line on a chart, you can spot this phenomenon.
Bullish divergence may indicate that a declining trend is subsiding and that prices will likely soon start to rise. This signal is used by traders as a buy signal. When the price makes a lower low but the MACD produces a higher low, this happens specifically.
On the other hand, bearish divergence can indicate that buy pressure is weakening and that a price reversal may be imminent. When a coin’s price, such as the KCS price, reaches a higher high but the MACD reaches a lower high, a signal is generated. This is interpreted by traders as an indication of market weakness, and they can now try to make money.
Keep an Eye Out for Sudden Rises or Falls
See how the MACD’s short- and long-term averages differ from one another. It becomes clear which way prices are moving when the short-term average increases or falls faster than the long-term average.
An asset is becoming overbought or oversold when it rises or falls quickly, indicating that a price correction may be on the horizon.
Putting It All
The MACD indicator is used by traders to spot shifts in the intensity or direction of a stock’s price trend. Because they rely on another mathematical concept known as an exponentially weighted moving average, exponential moving averages (EMAs), which are the foundation of the MACD indicator, may initially appear to be difficult to understand (EWMA).
Fundamentally, though, MACD aids traders in identifying instances where a stock’s recent price movement may indicate a change in the underlying trend. This can assist traders in determining when to enter, increase, or leave positions.
Overall, the MACD indicator can be a helpful tool for investors. To make wise trading decisions, it’s crucial to combine the MACD with other indicators and fundamental analysis, as with any technical analysis tools.